Click on the Key Graph of the Brown to Green Report 2017 to open in new window for download or download bundle at the end of the table …

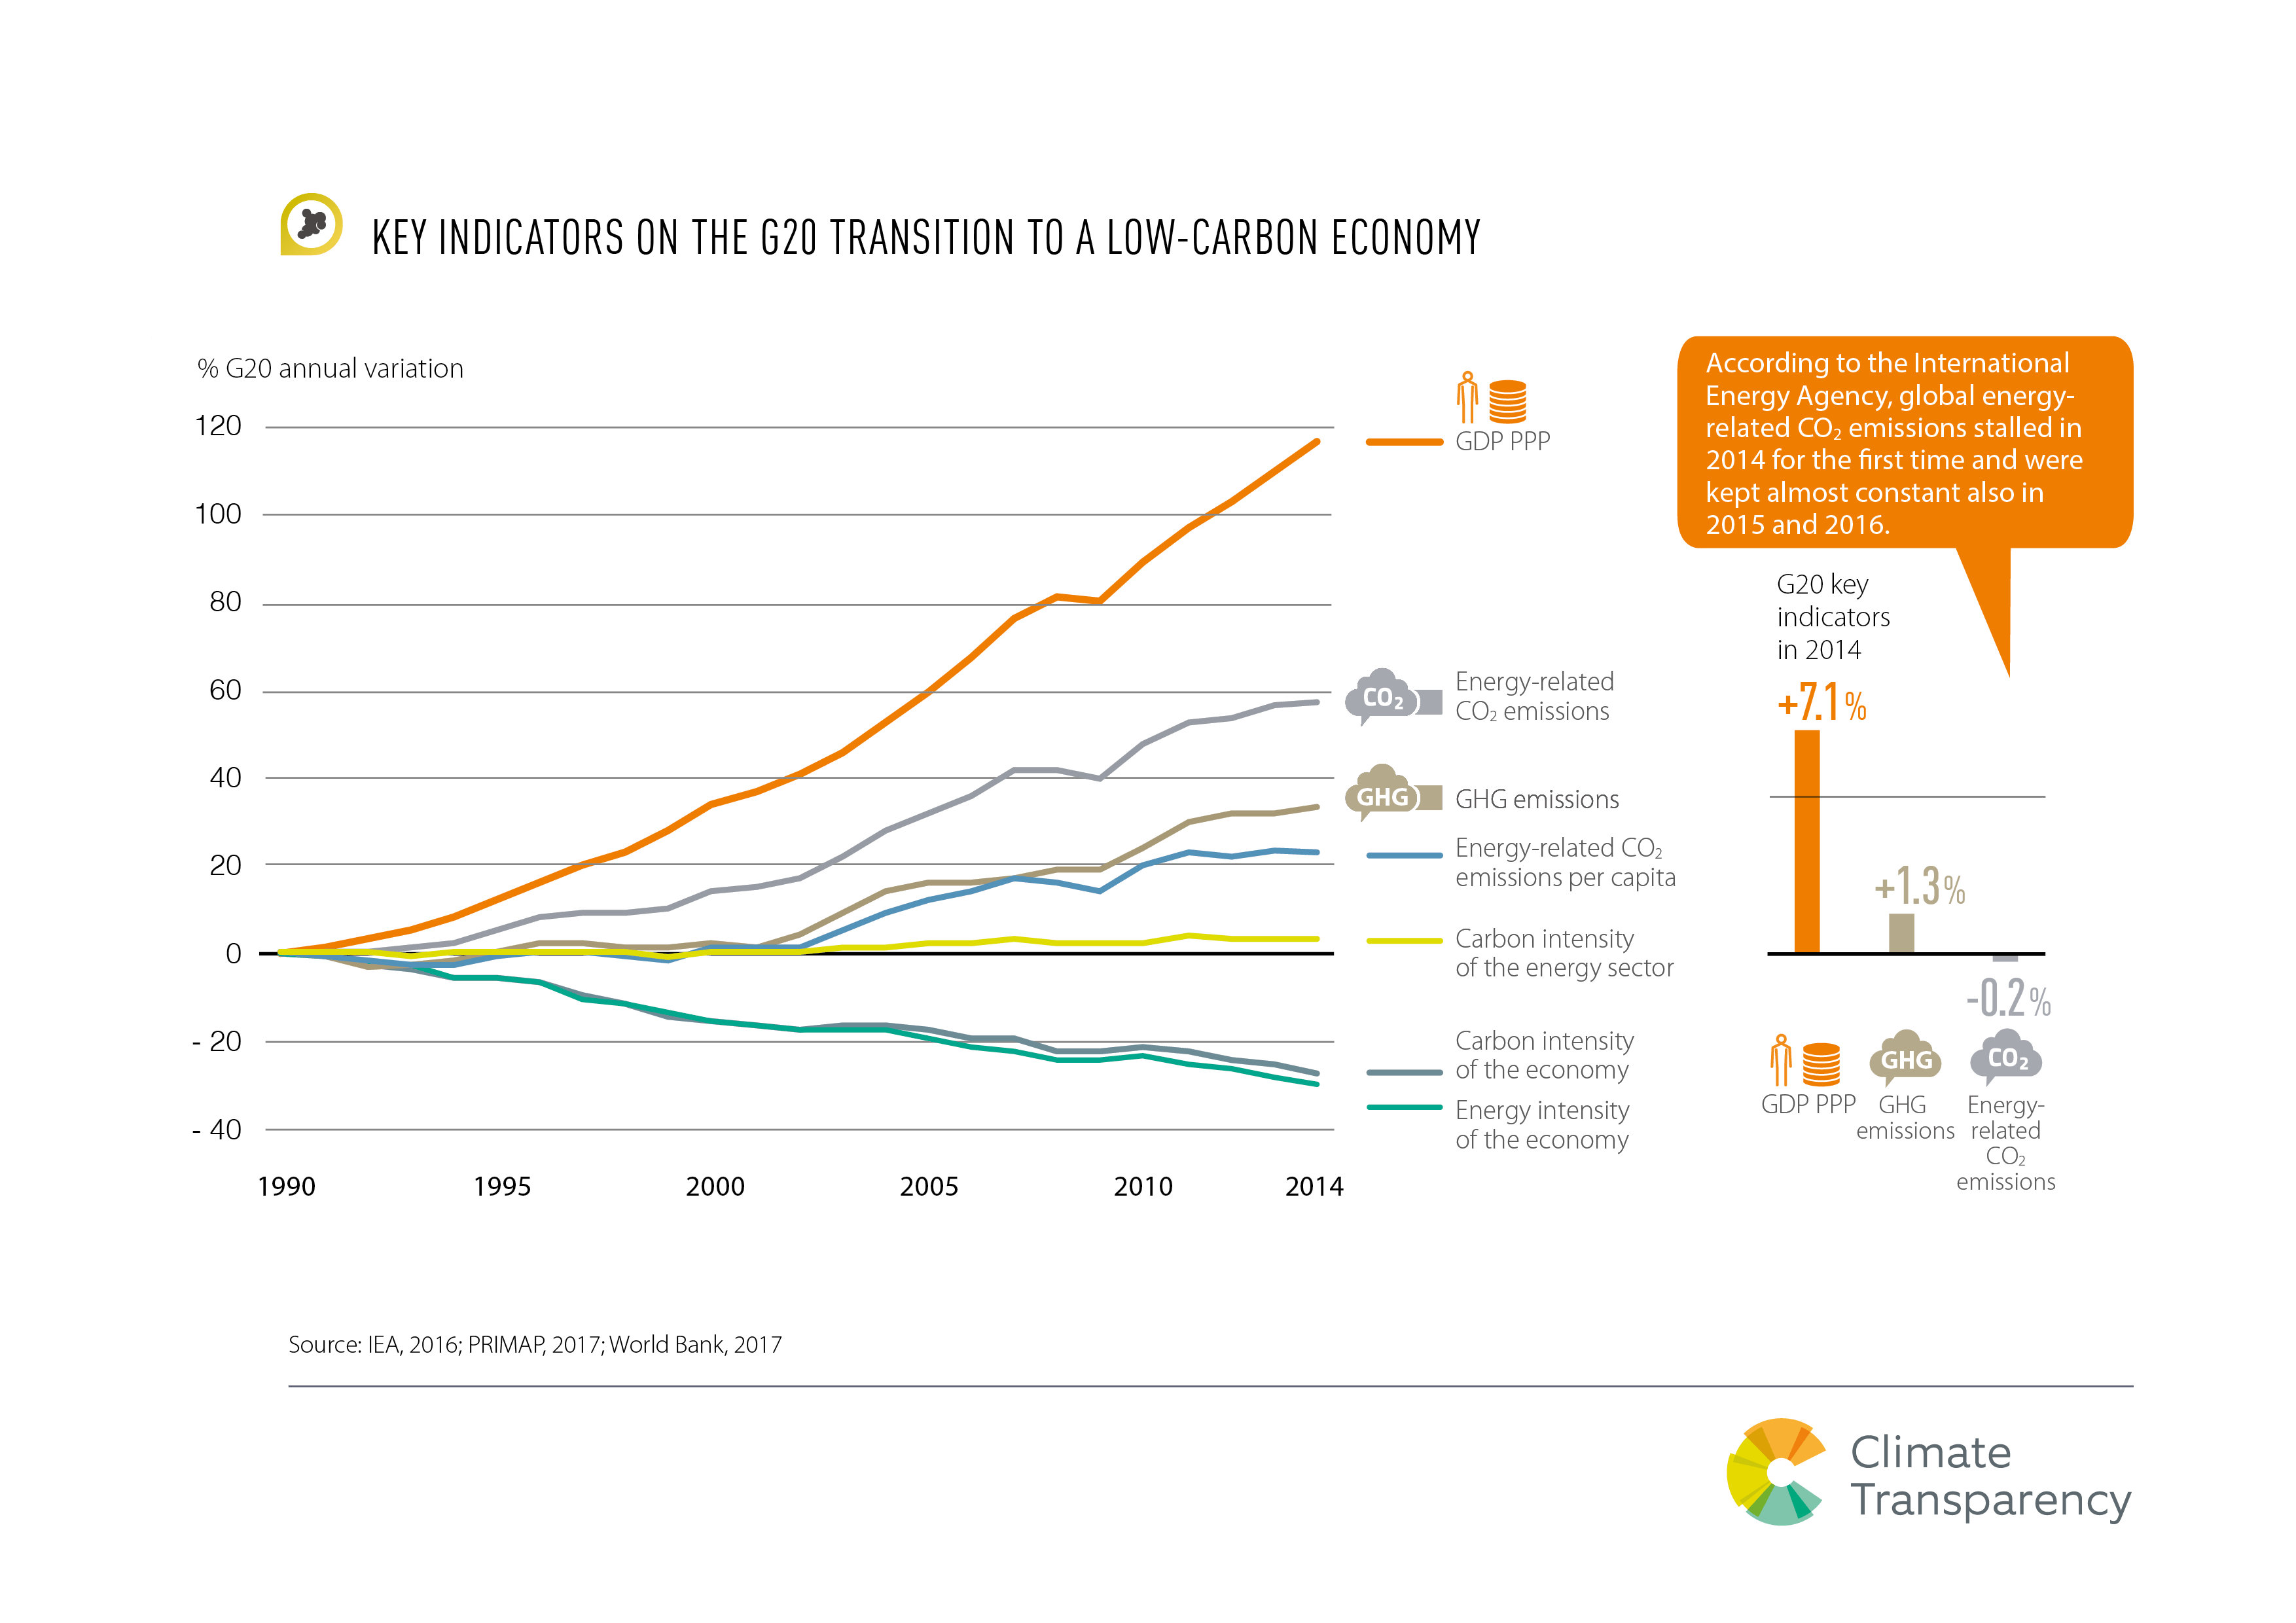
Key indicators on the G20 transition to a low-carbon economy
Shows % G20 annual variation of 1) GDP PPP; 2) Energy-related CO2 emissions; 3) GHG Emissions; 4) Energy-related CO2 emissions per capita; 5) Carbon intensity of the energy sector.

Key indicators on the G20 transition to a low-carbon economy (a)
Shows % G20 annual variation of 1) GDP PPP; 2) Energy-related CO2 emissions; 3) GHG Emissions; 4) Energy-related CO2 emissions per capita; 5) Carbon intensity of the energy sector.
Special focus: Enery-related CO2 emissions
Key indicators on the G20 transition to a low-carbon economy (b)
Shows % G20 annual variation of 1) GDP PPP; 2) Energy-related CO2 emissions; 3) GHG Emissions; 4) Energy-related CO2 emissions per capita; 5) Carbon intensity of the energy sector.
Special focus: Carbon intensity of energy sector
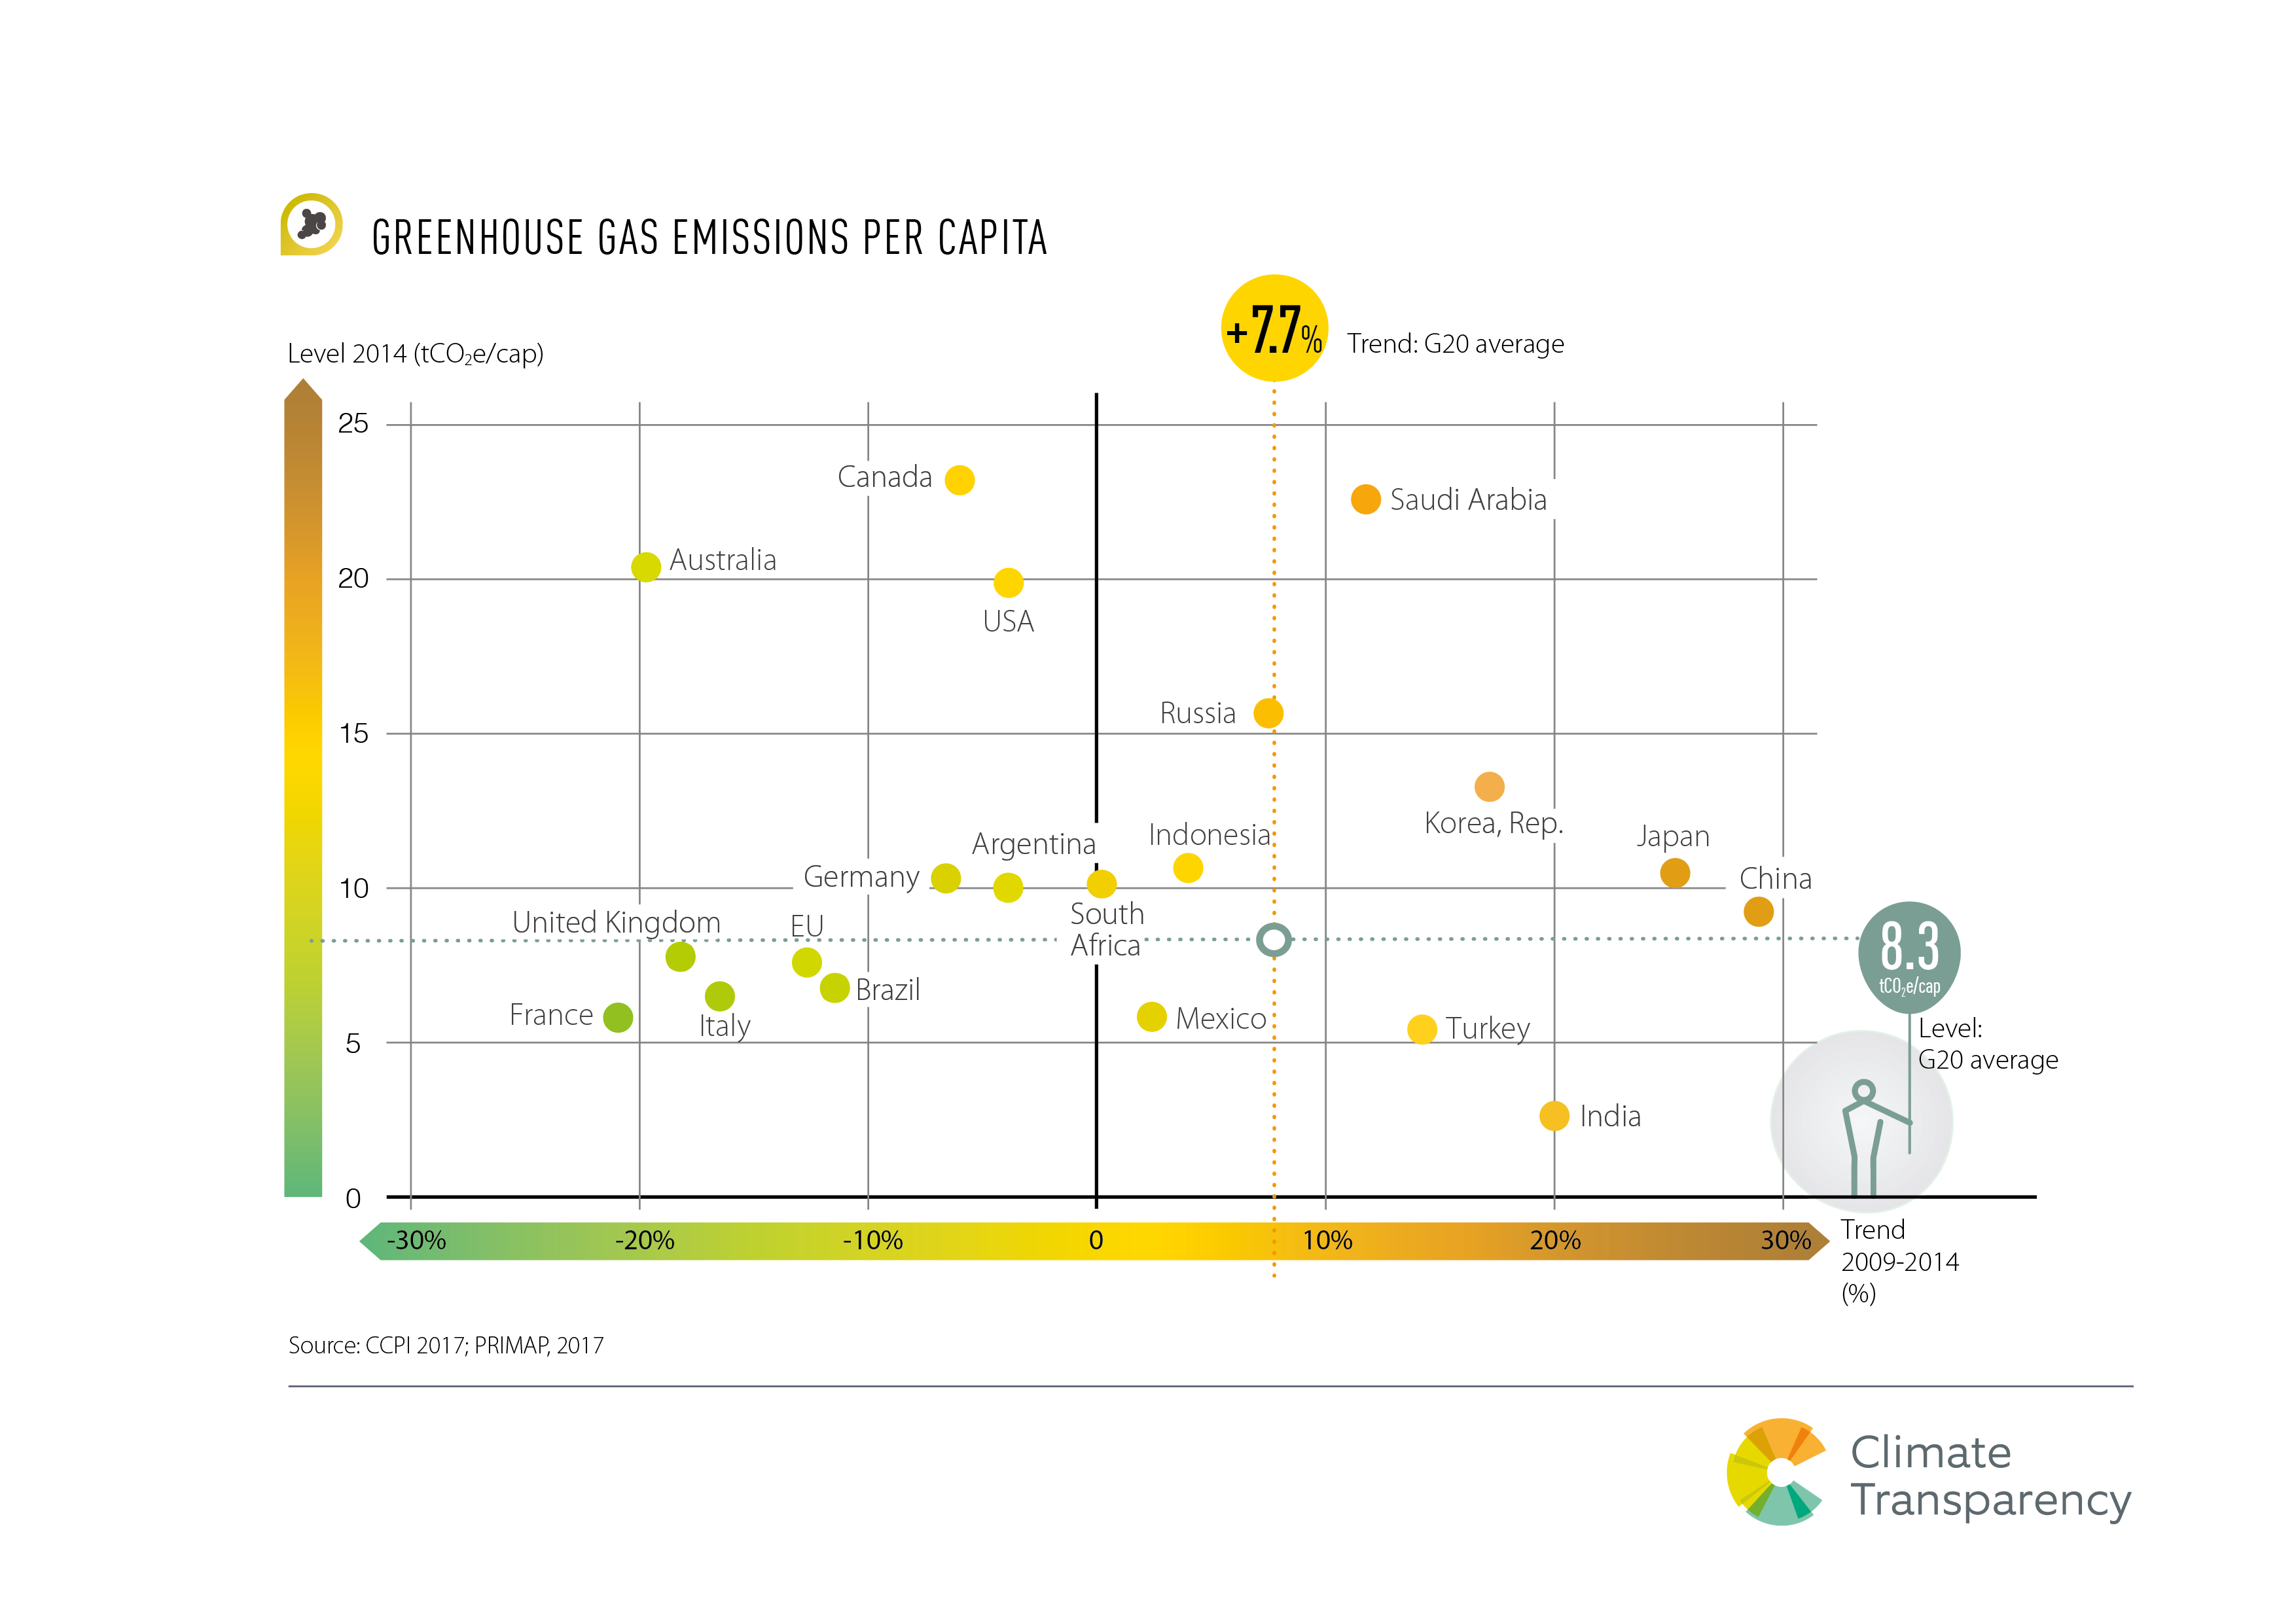
Greenhouse Gas Emissions per capita
Comparison of level and trend for all G20 countries
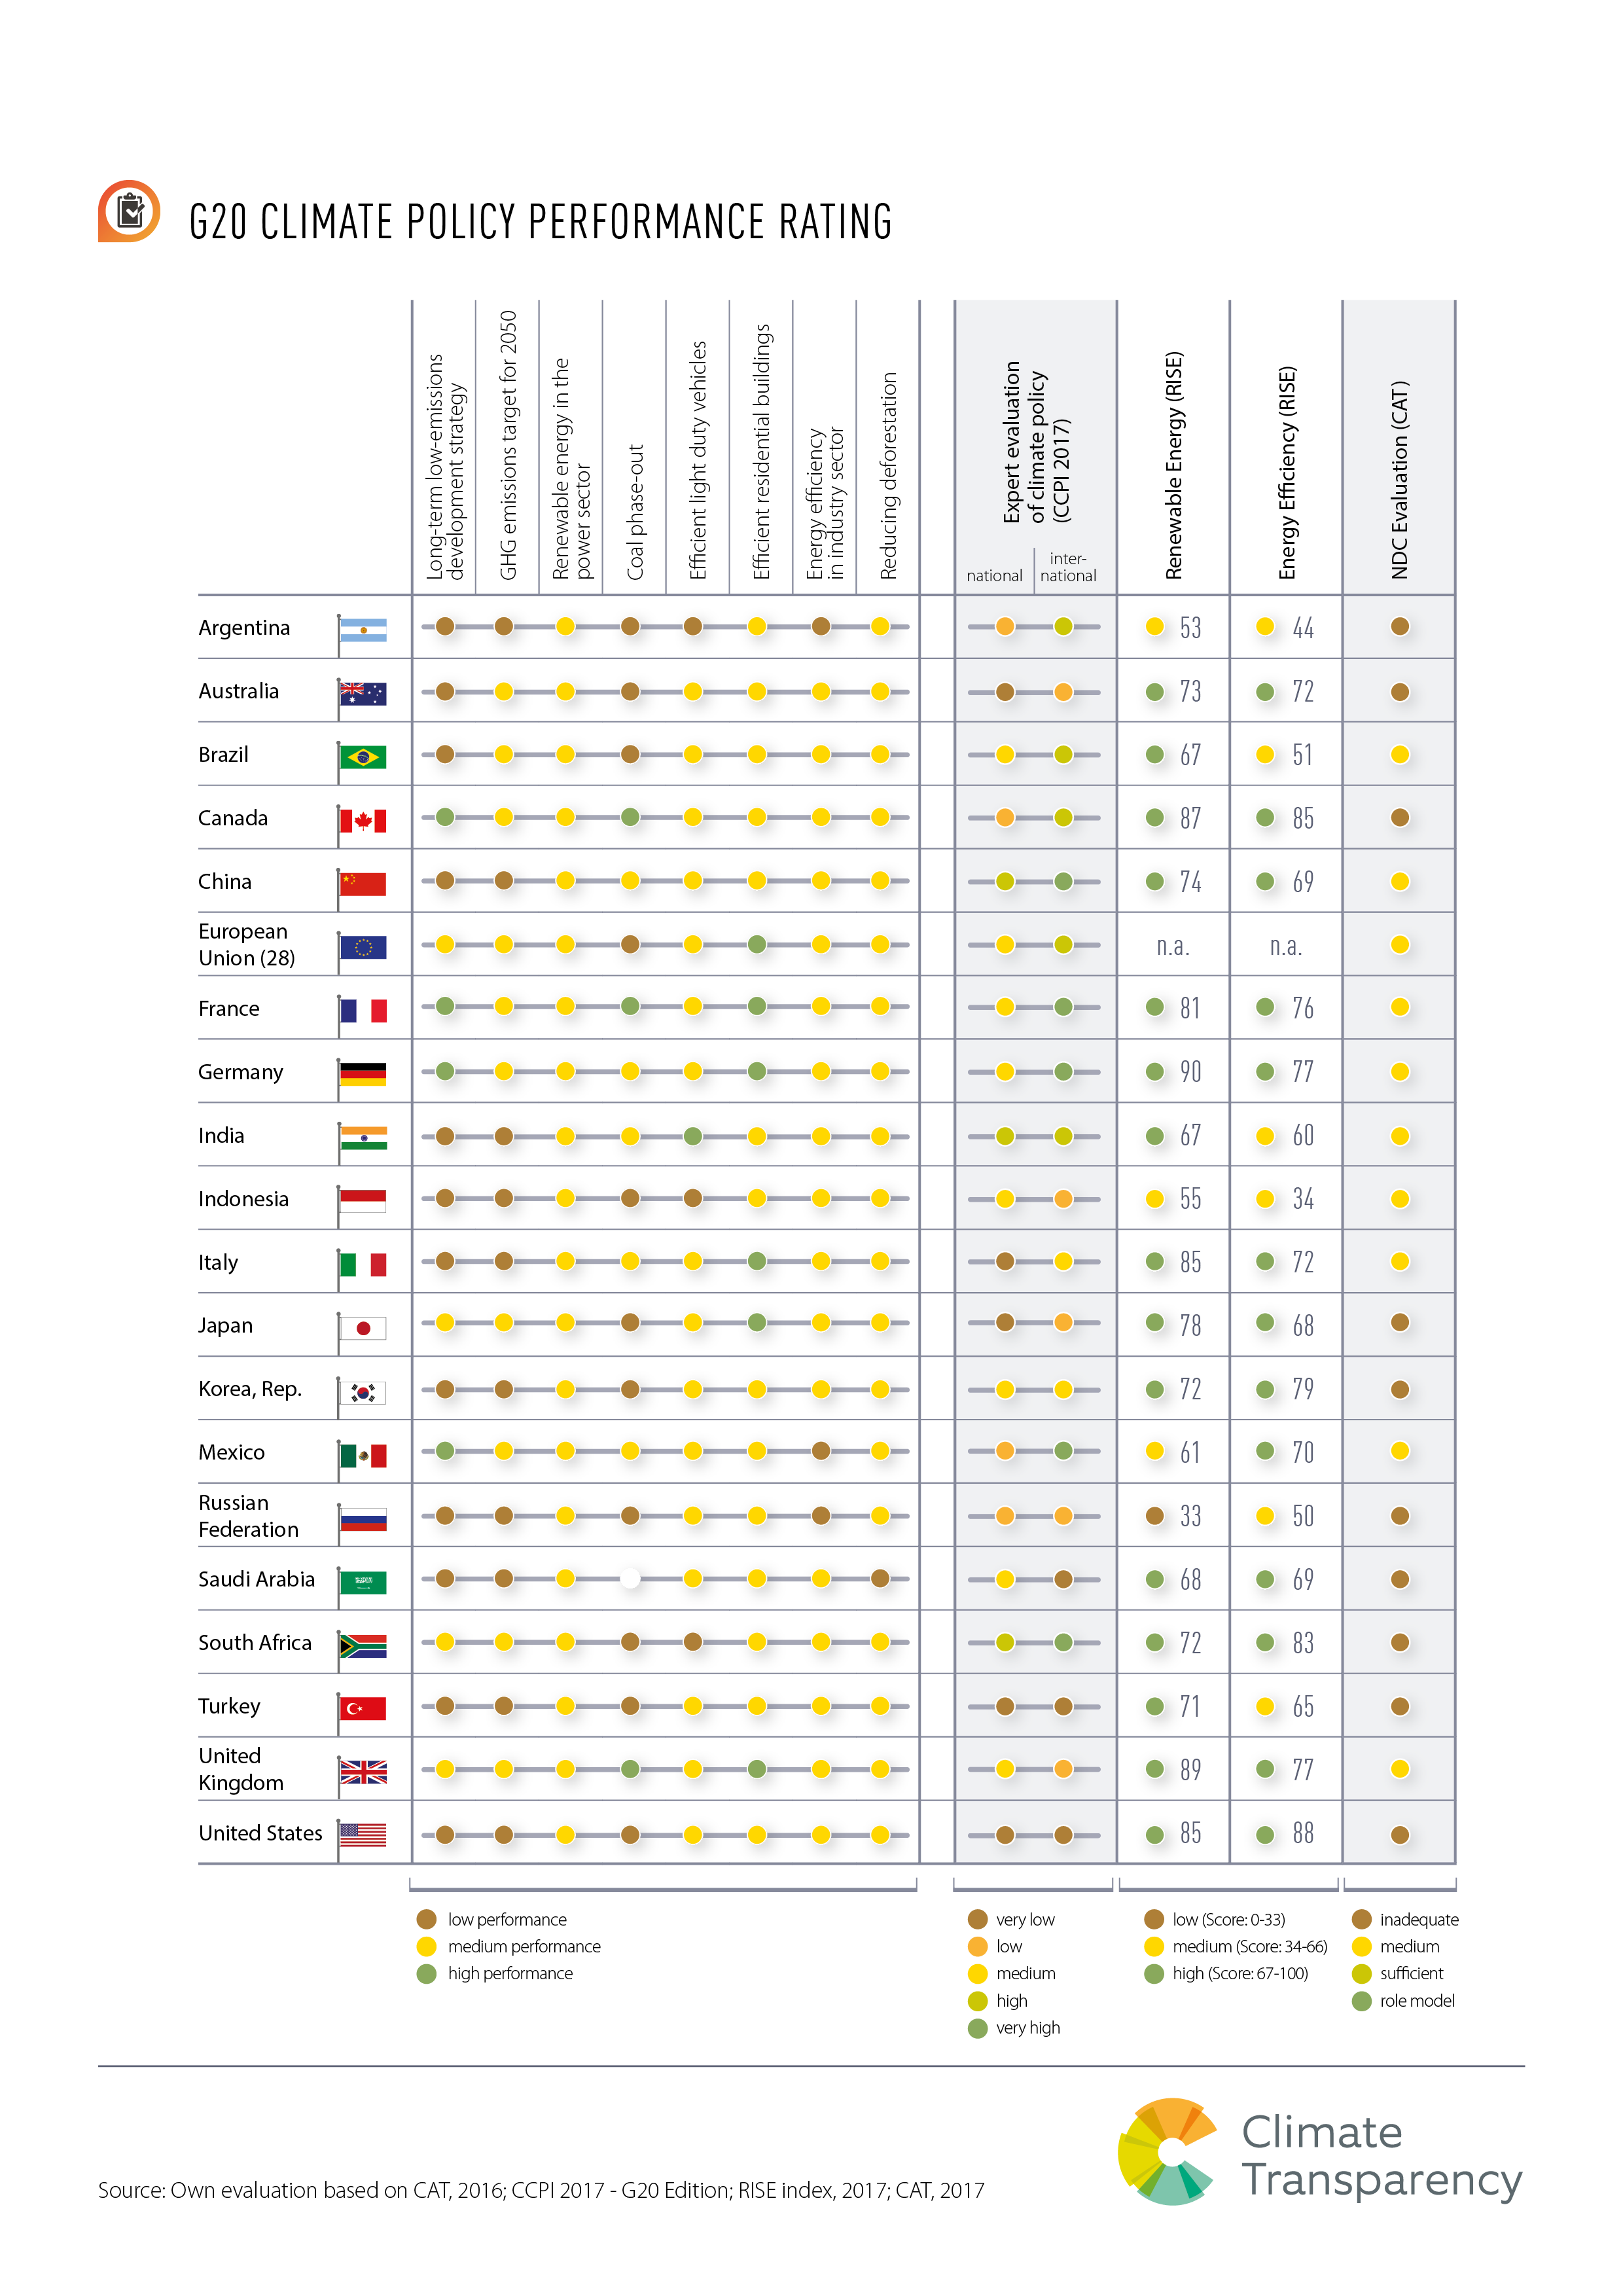
G20 Climate Policy Performance Rating
Sumarizes for all G20 countries 1) Expert Evaluation of Climate Policy (CCPI 2017); 2) Renewable Energy (RISE); 3) Energy Efficiency (RISE); 4) NDC Evaluation (CAT).

Investment Attractiveness for Renewable Energy
Summarizes for all G20 countries Investment Attractiveness for Renewable Energy according to 1) Allianz Monitor; 2) RECAI Ranking and 3) RECAI Trend.
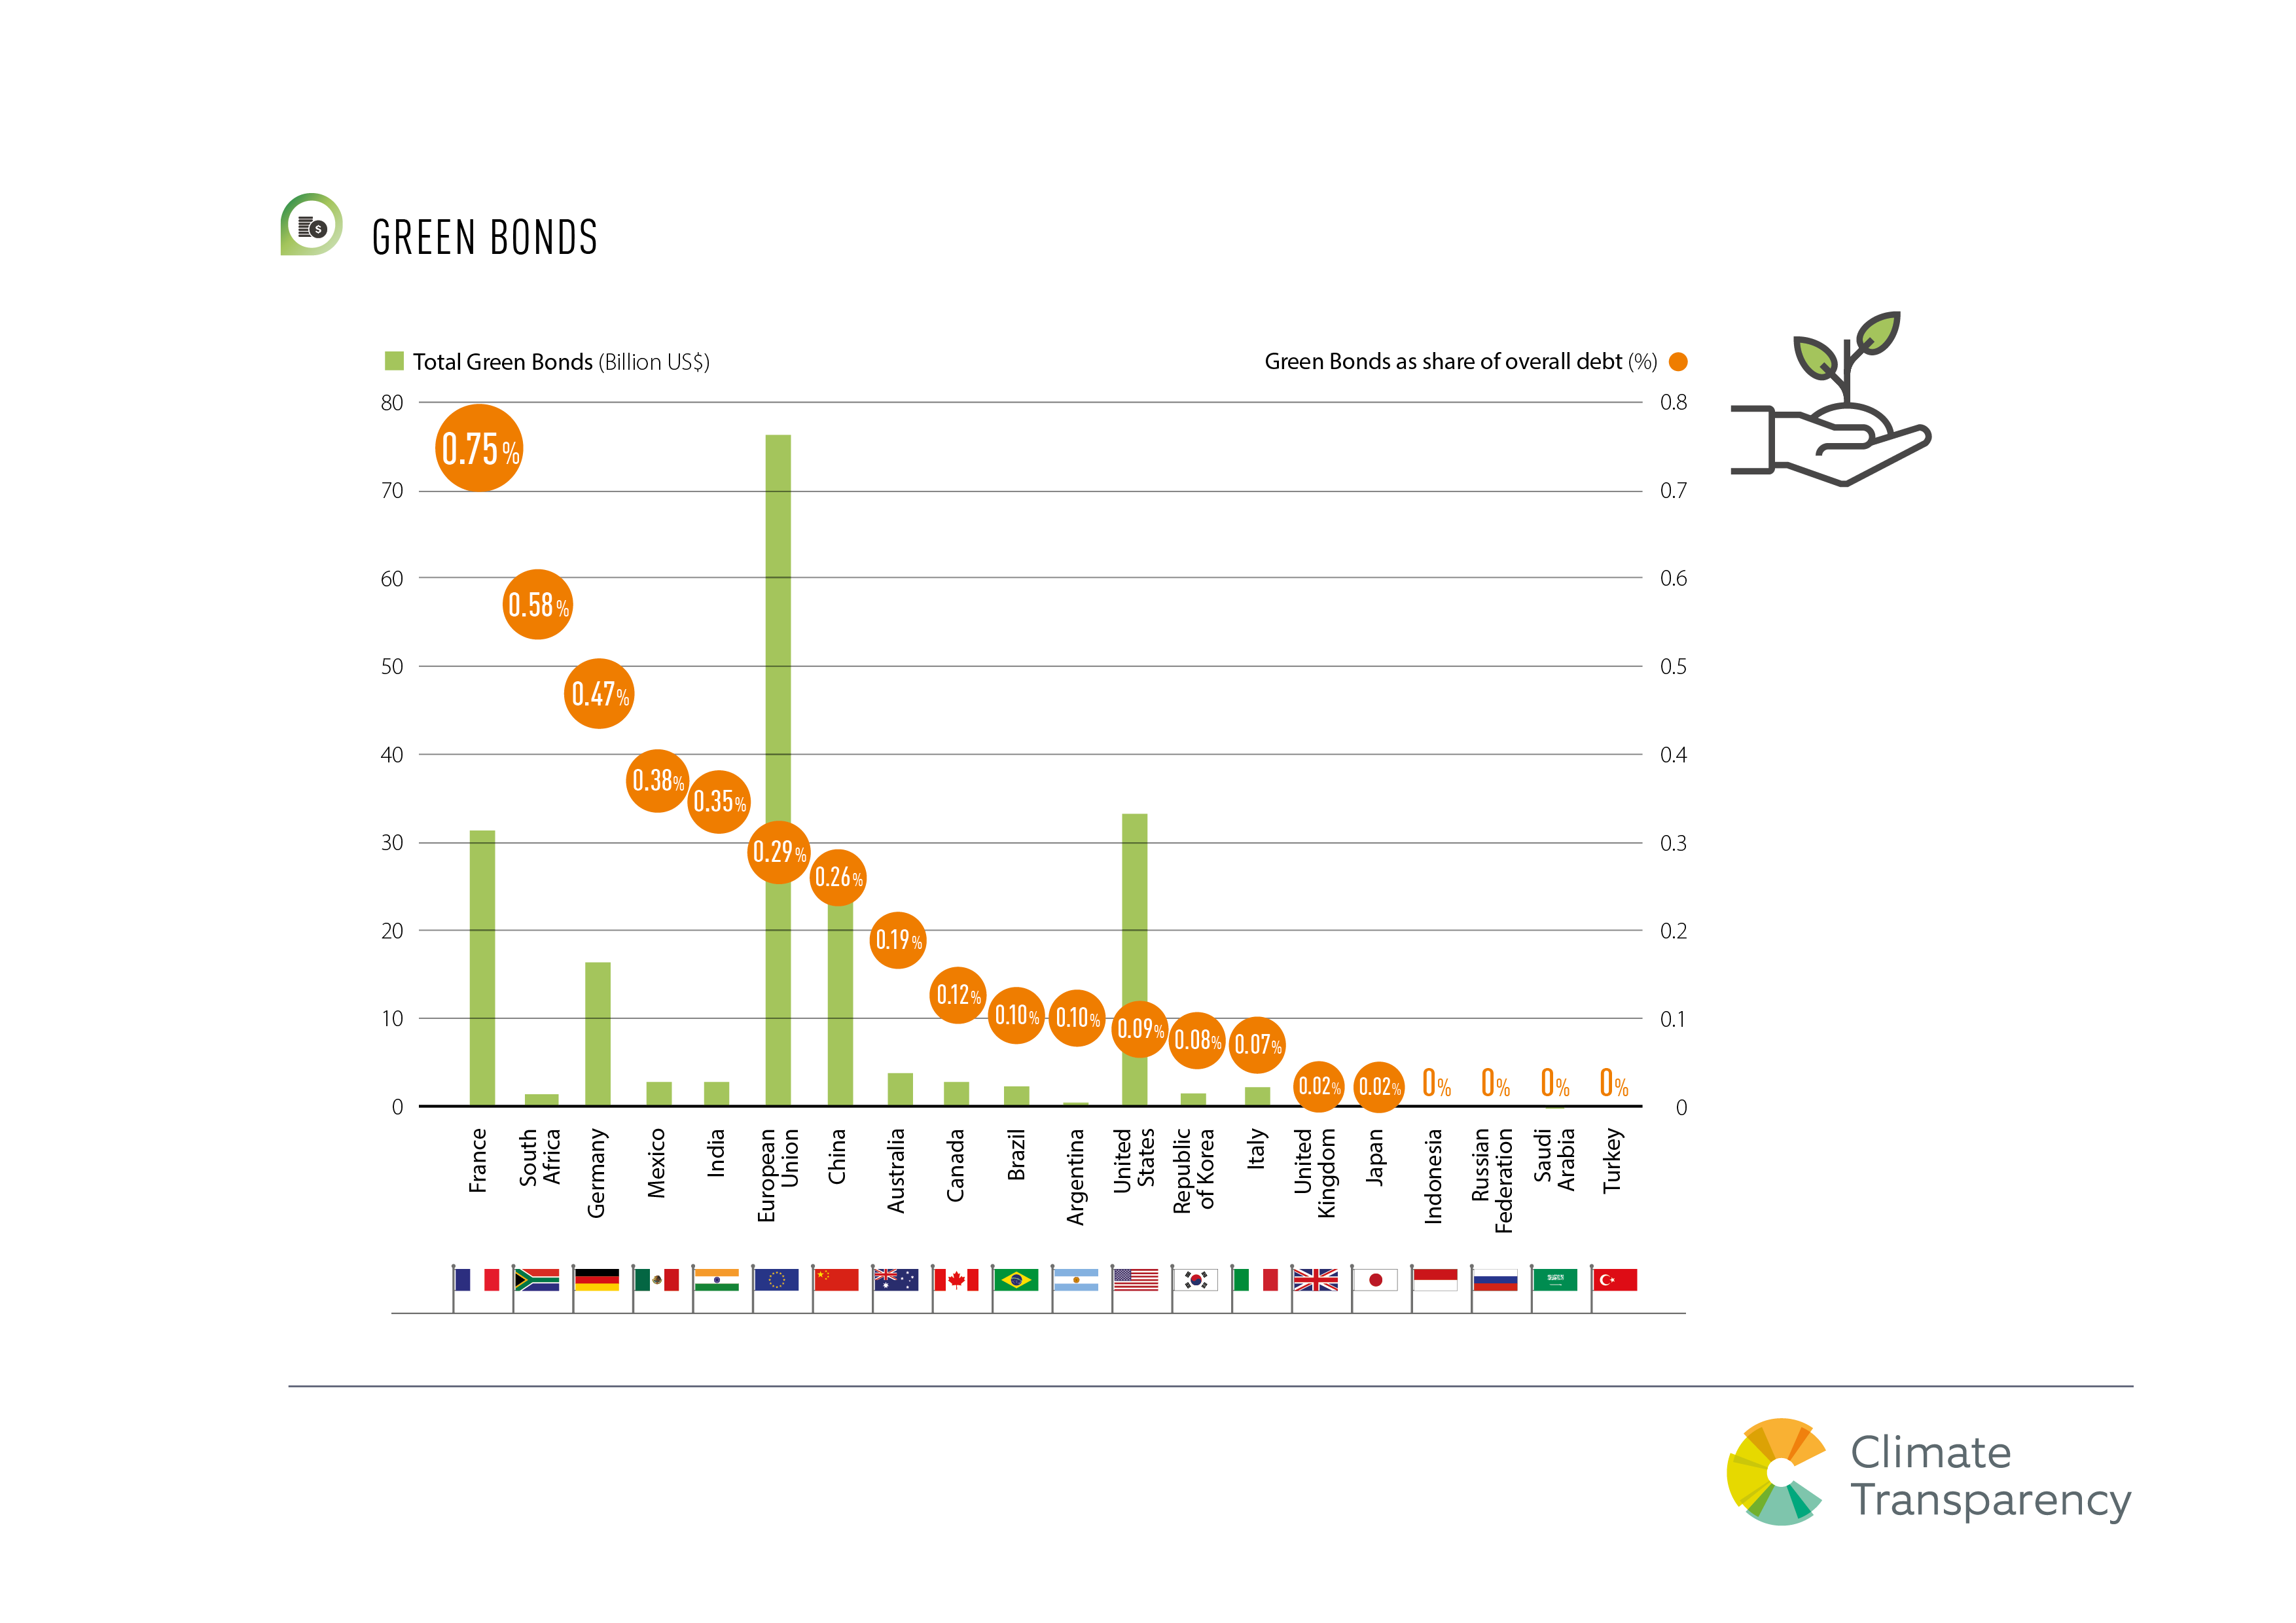
Green Bonds
Total green bonds (billion USD) and Green Bonds as share of overall dept for all G20 countries
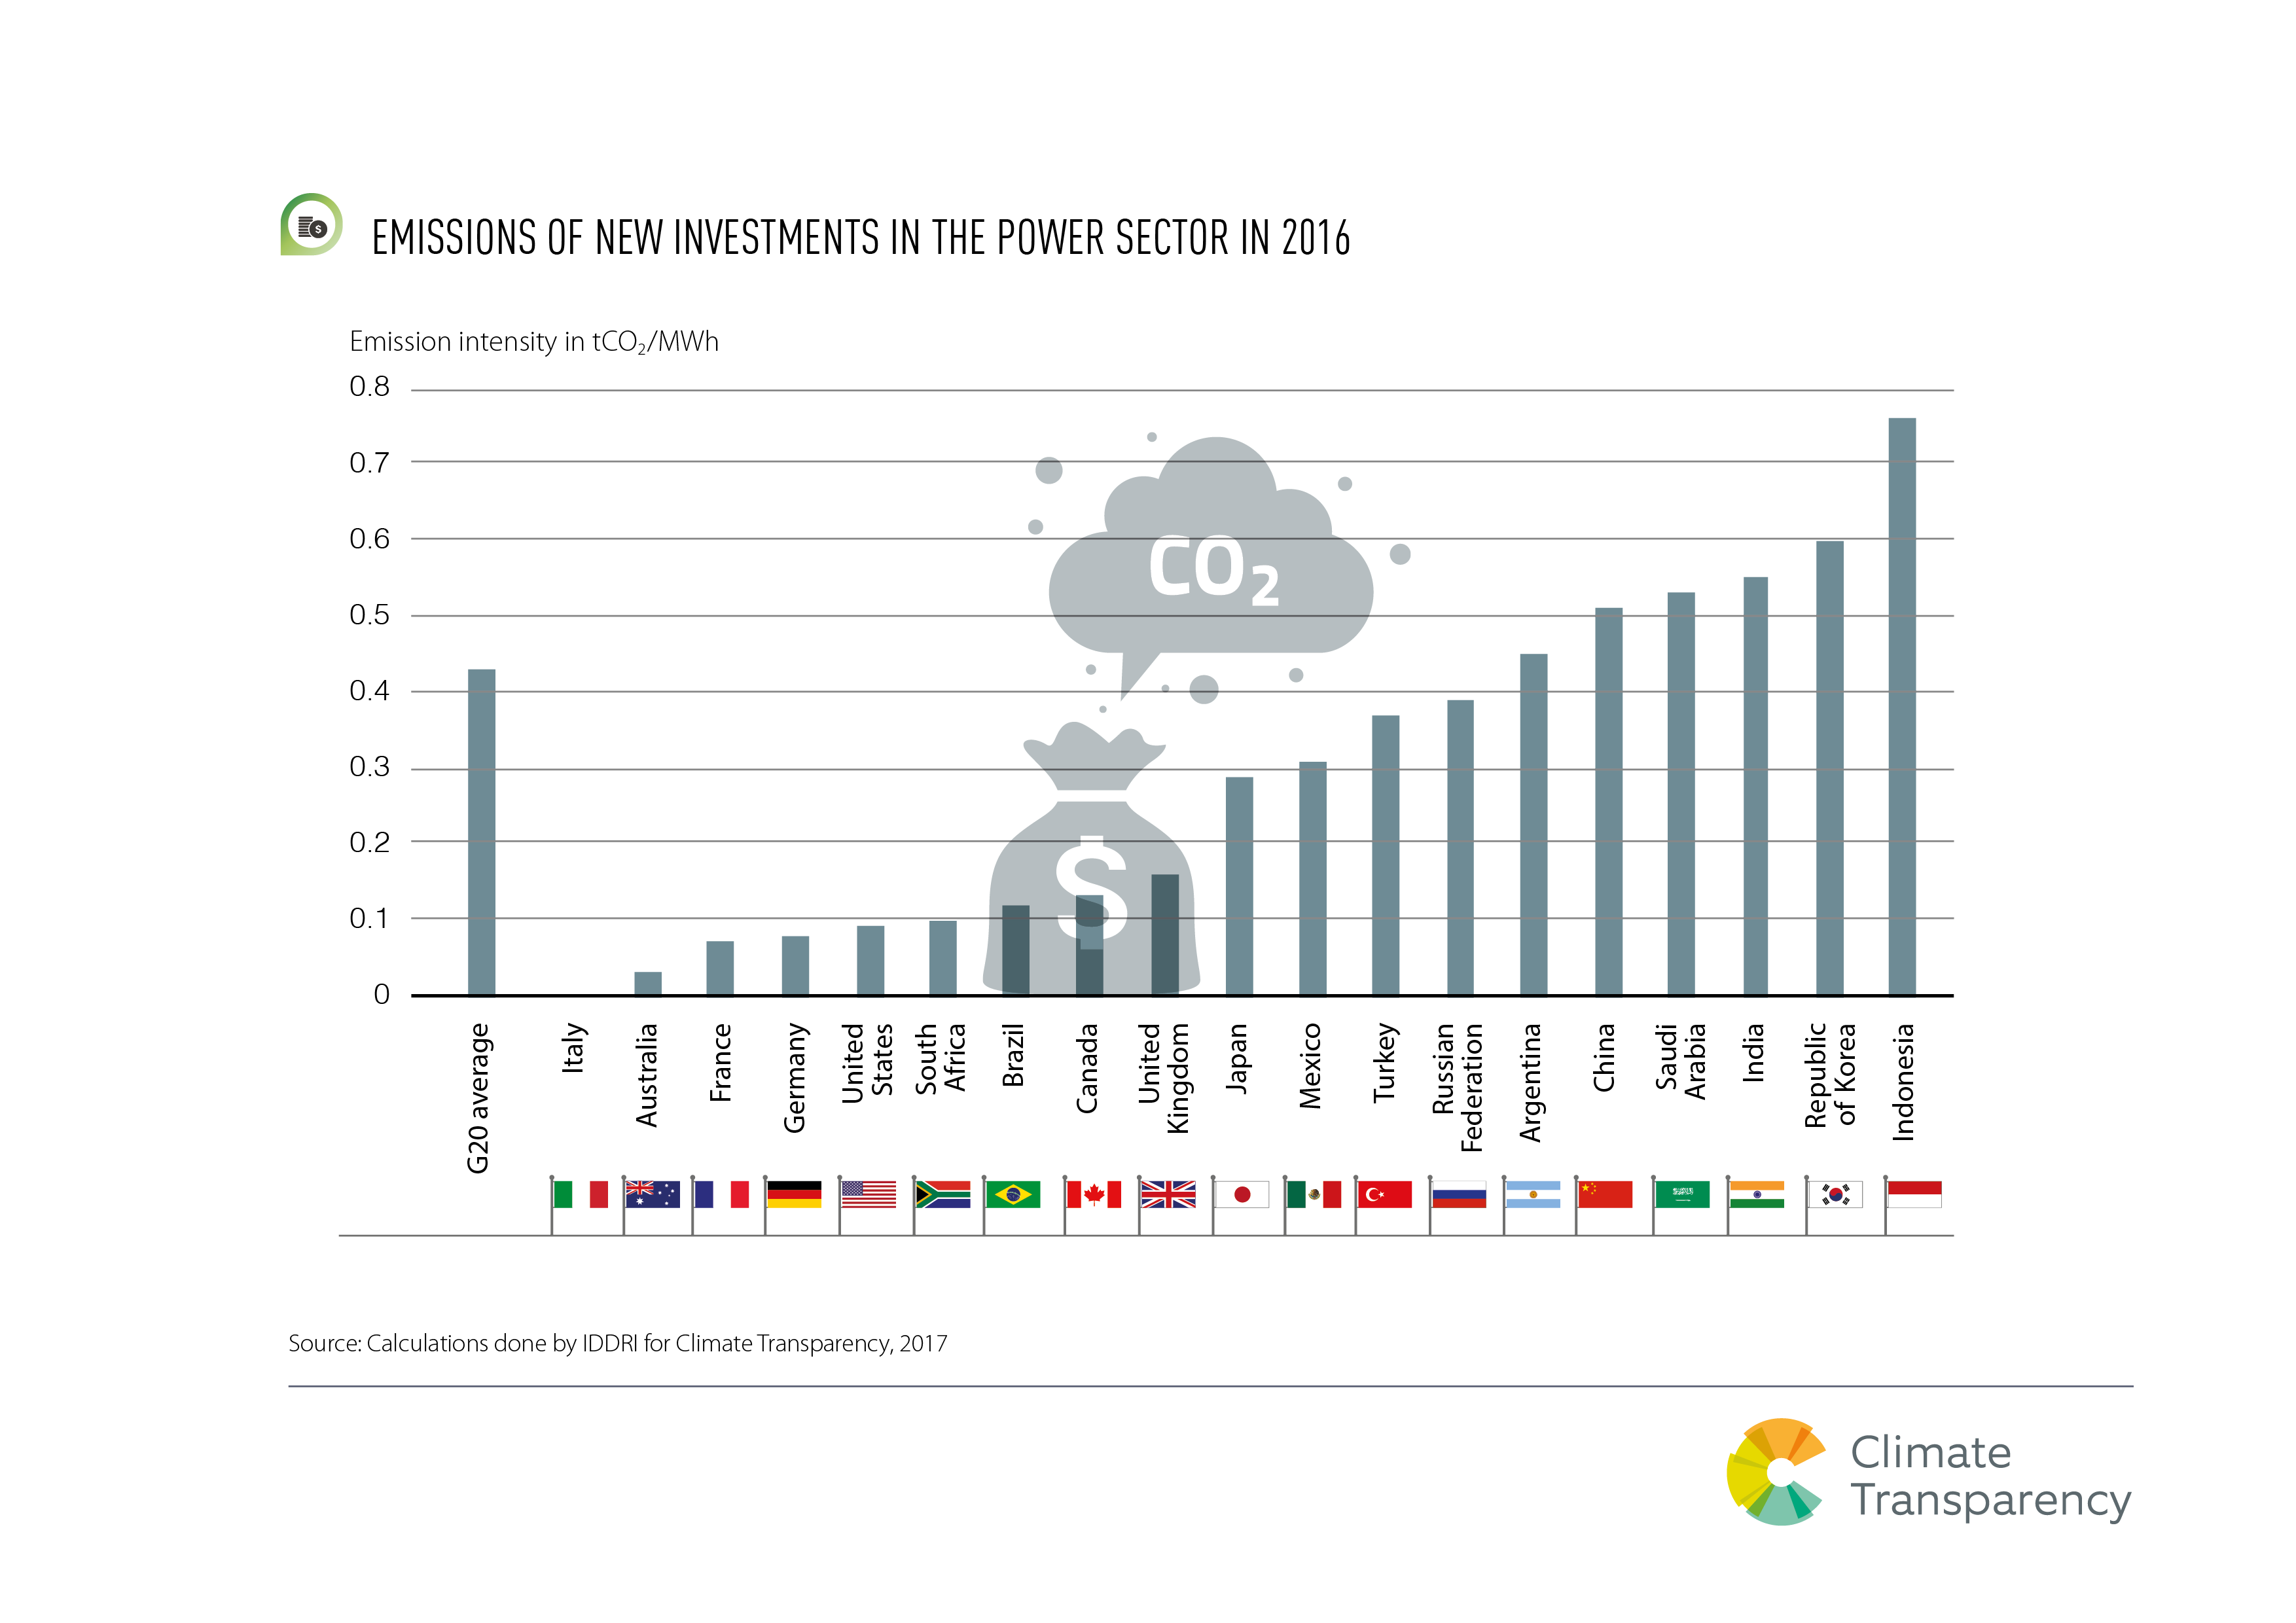
Emissions of New Investments in the Power Sector in 2016
Compares for all G20 countries emissions intensity in the power sector.
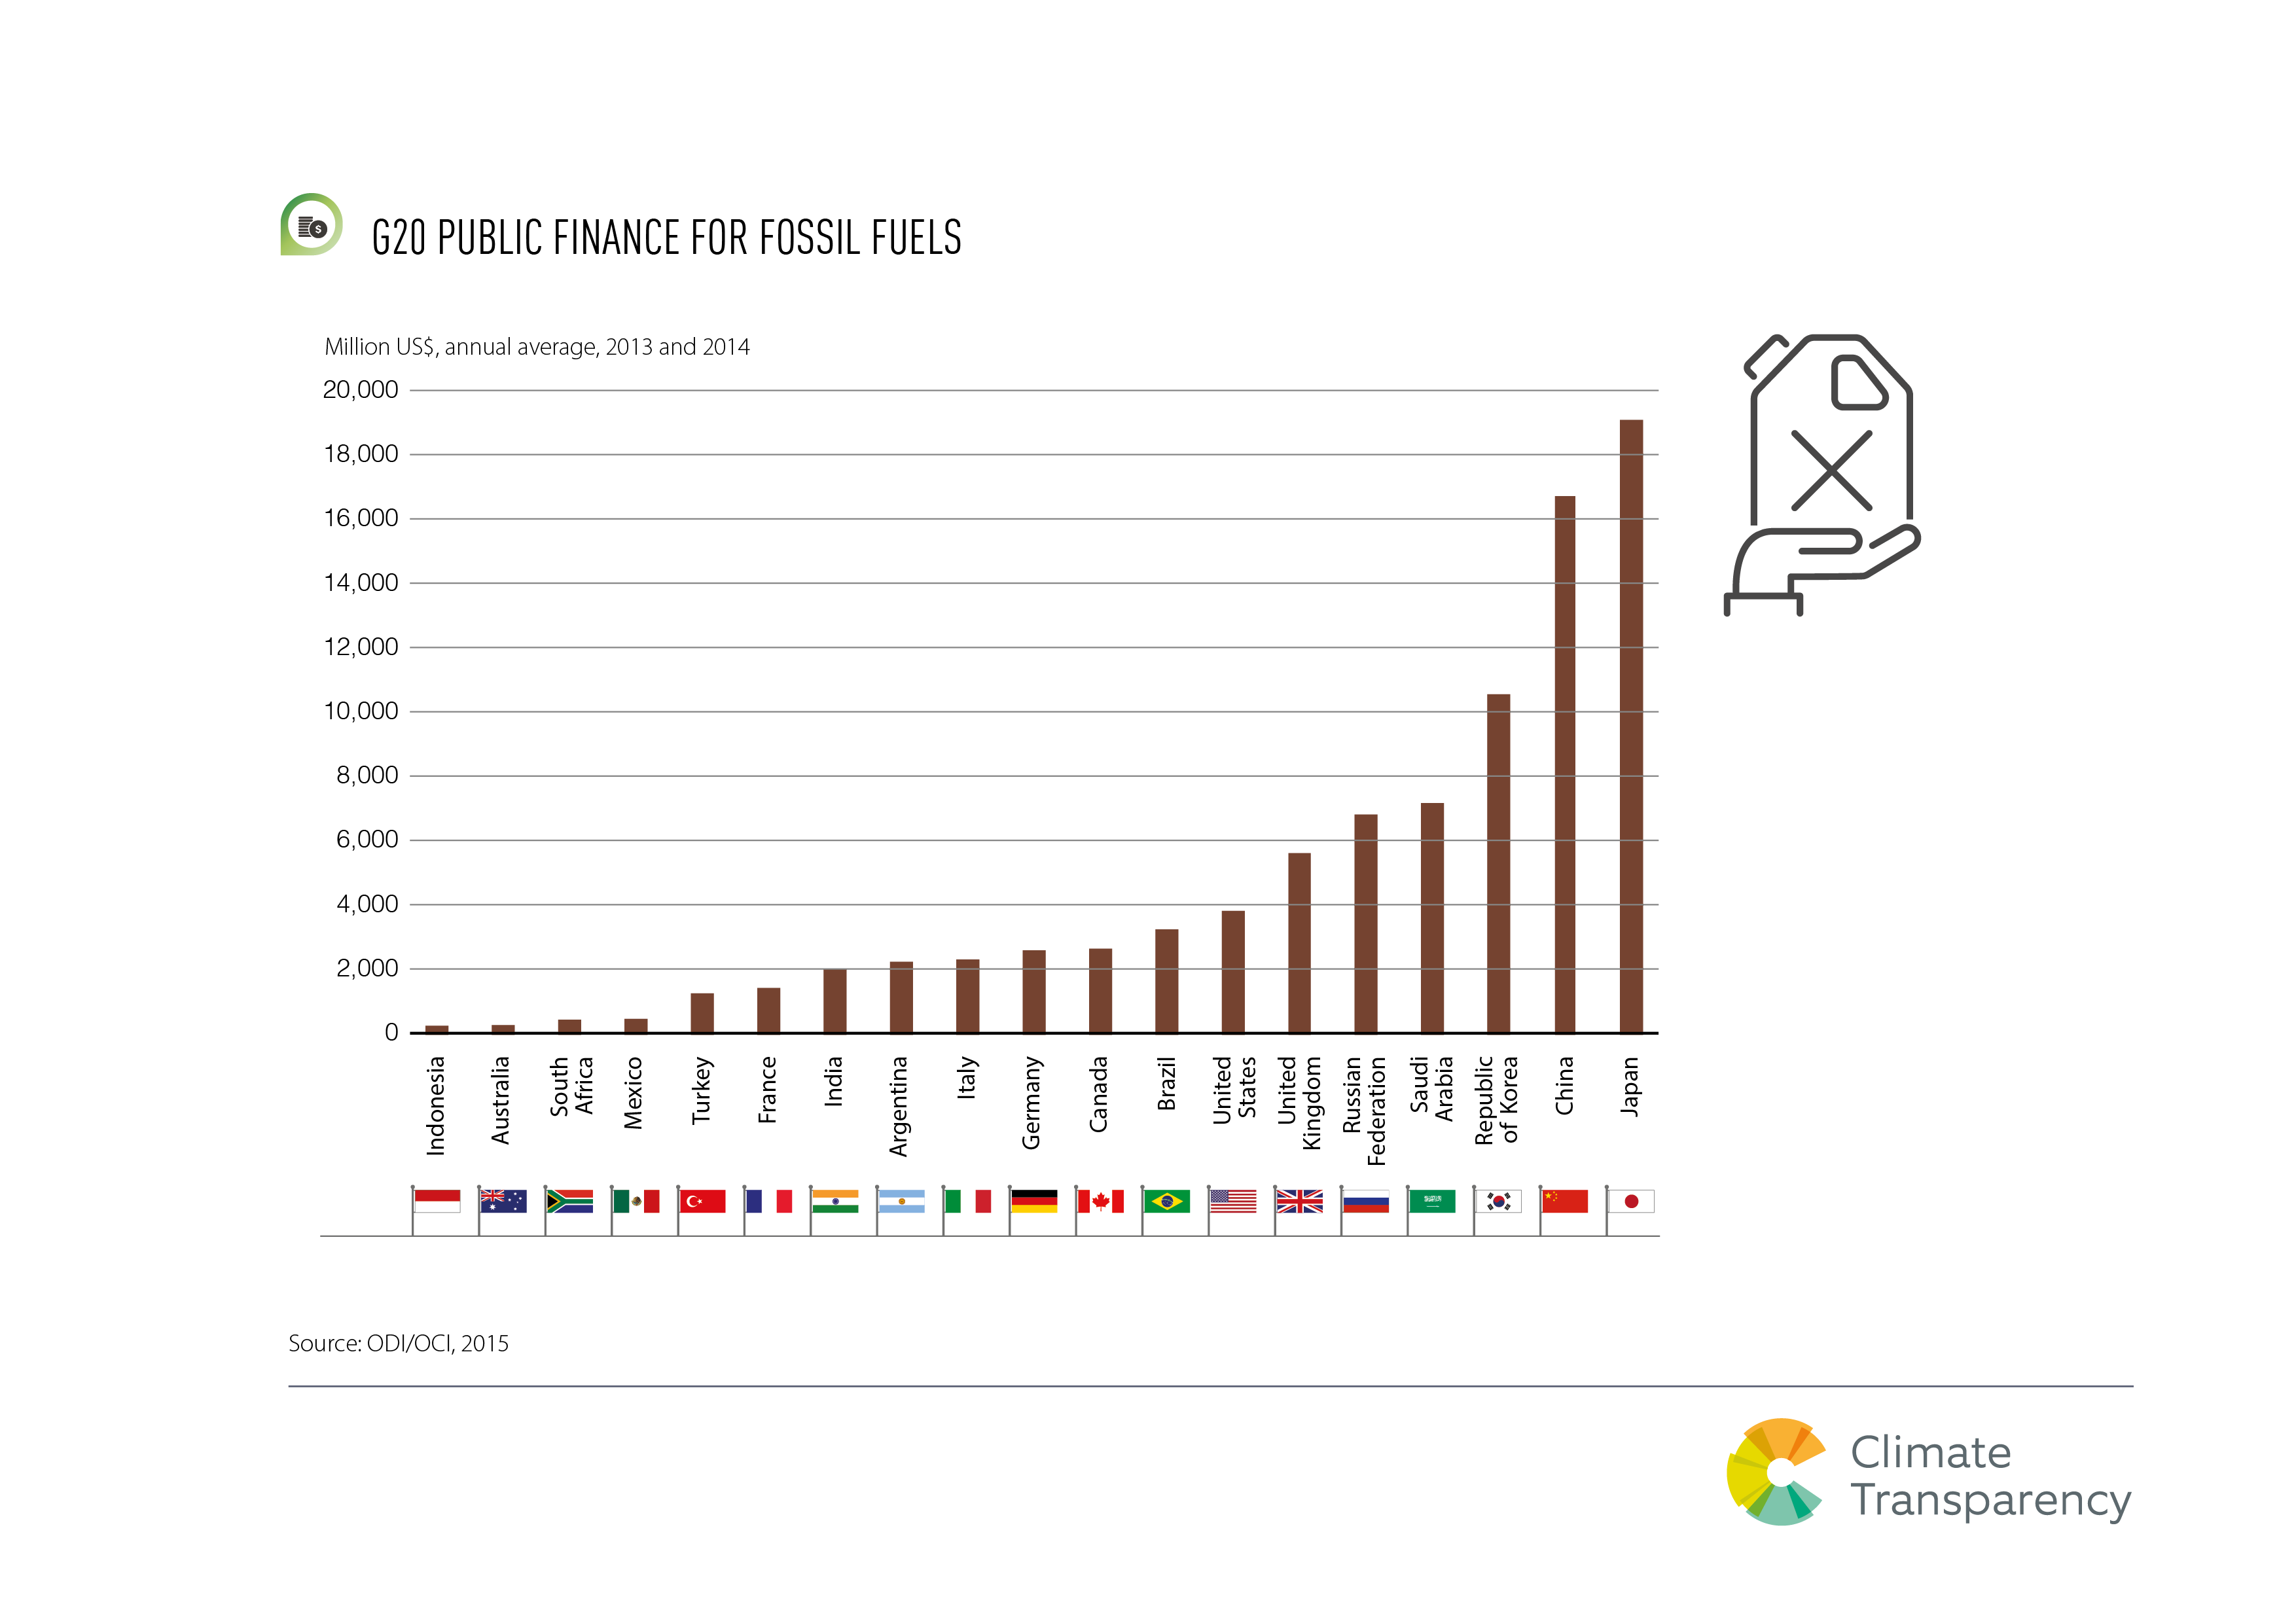
G20 Public Finance for Fossil Fuels
Compares for all G20 countries public finance for fossil fuels in million USD.
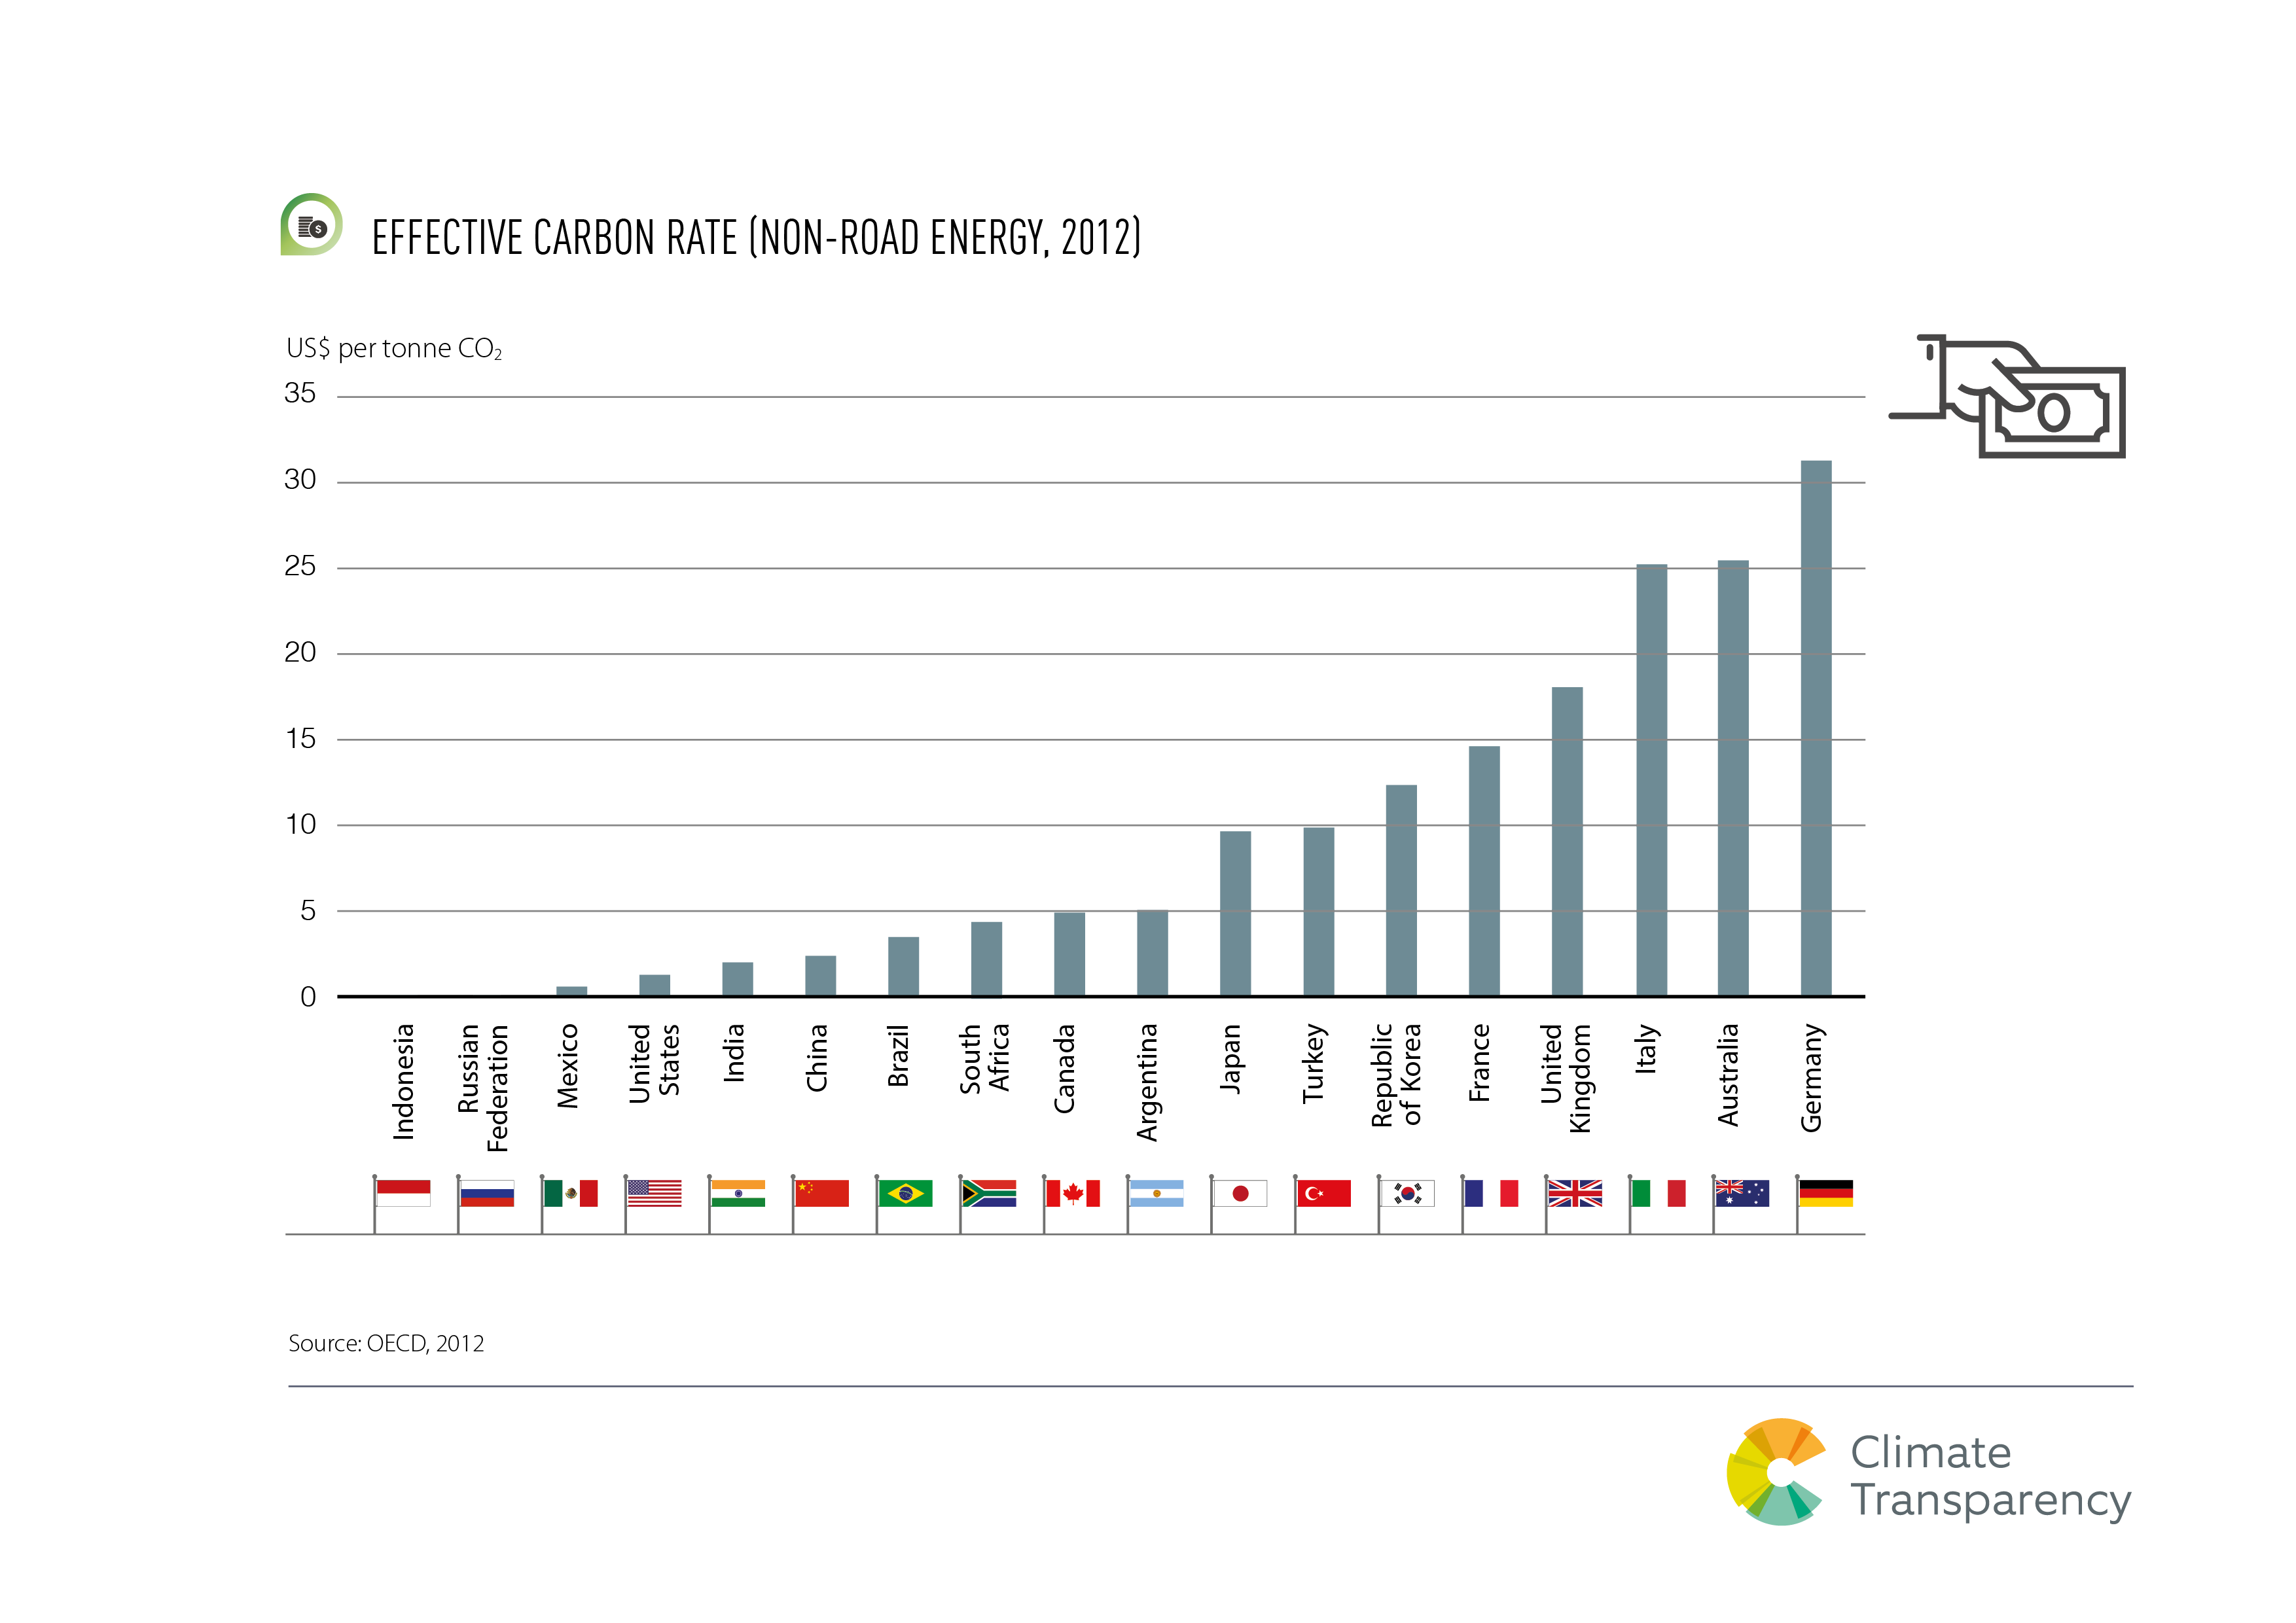
Effective Carbon Rate (Non-Road Energy, 2012)
Compares for all G20 countries effective carbon rate (non-road energy) in USD per tonne CO2.
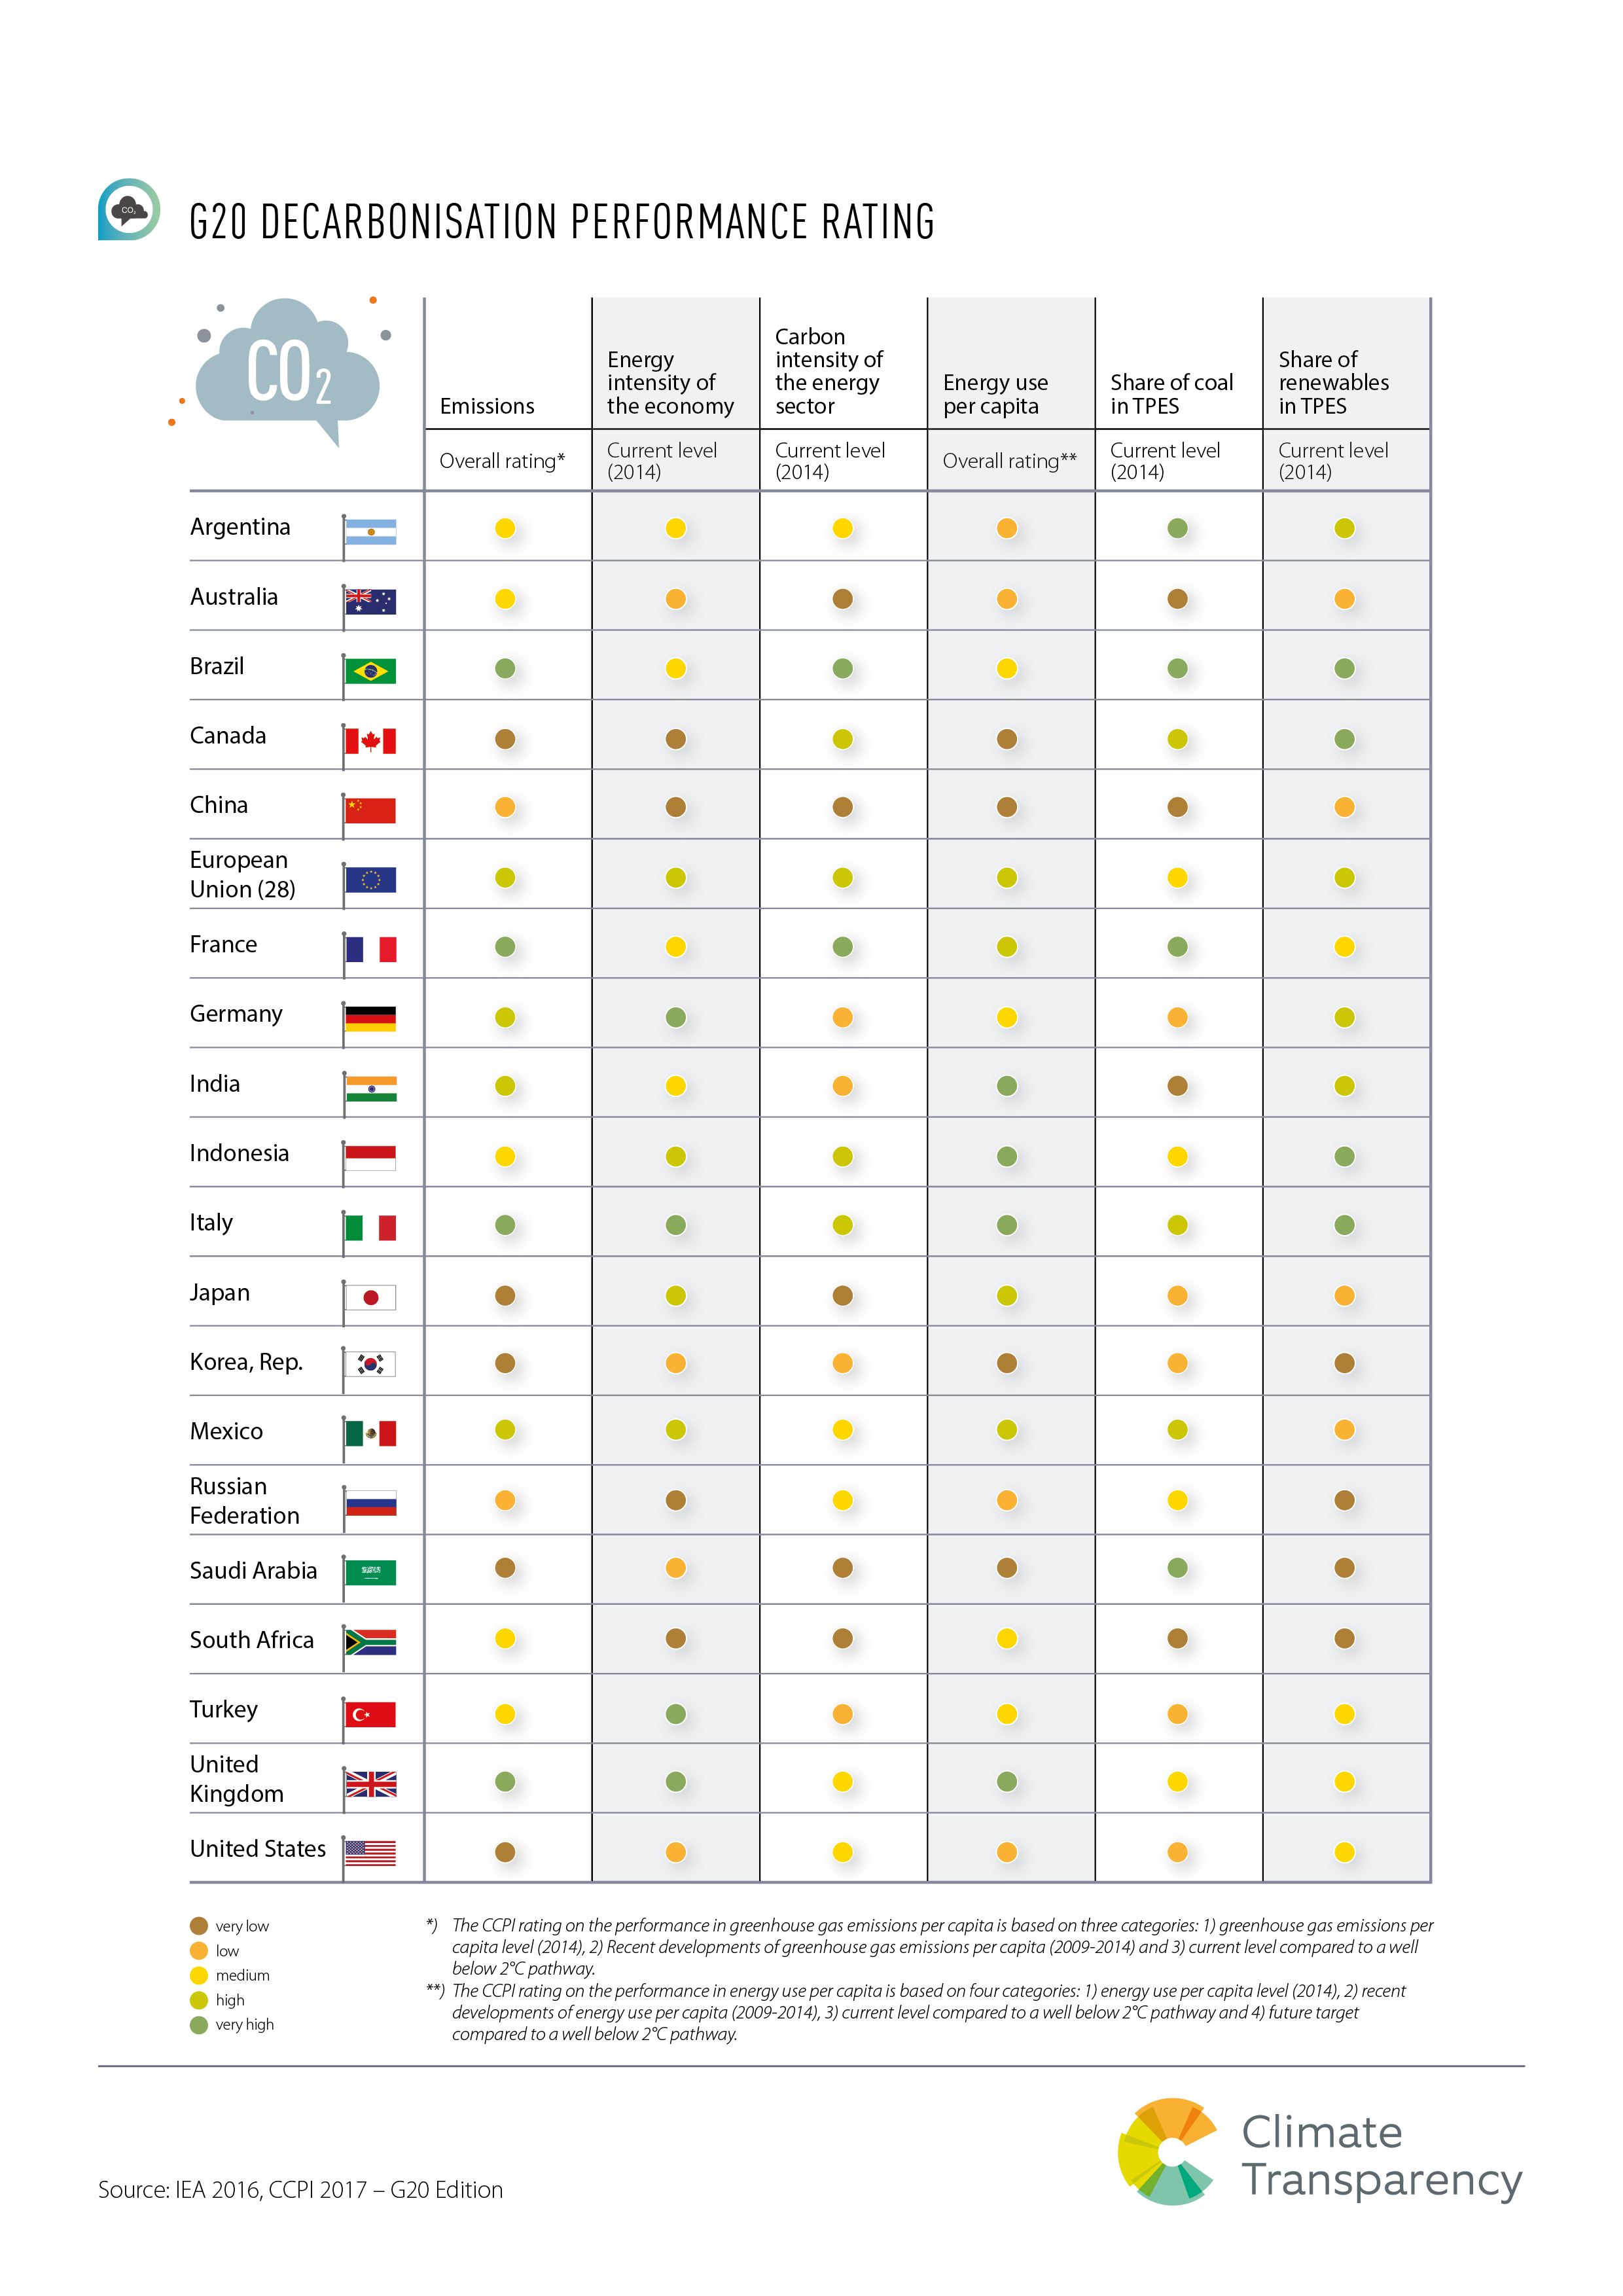
G20 Decarbonisation Performance Rating
Shows rating of all G20 countries in 1) Emissions; 2) Energy intensity of the economy; 3) Carbon intensity of the energy sector; 4) Energy use per capita; 5) Shares of coal in TPES and 6) Share of renewables in TPES.
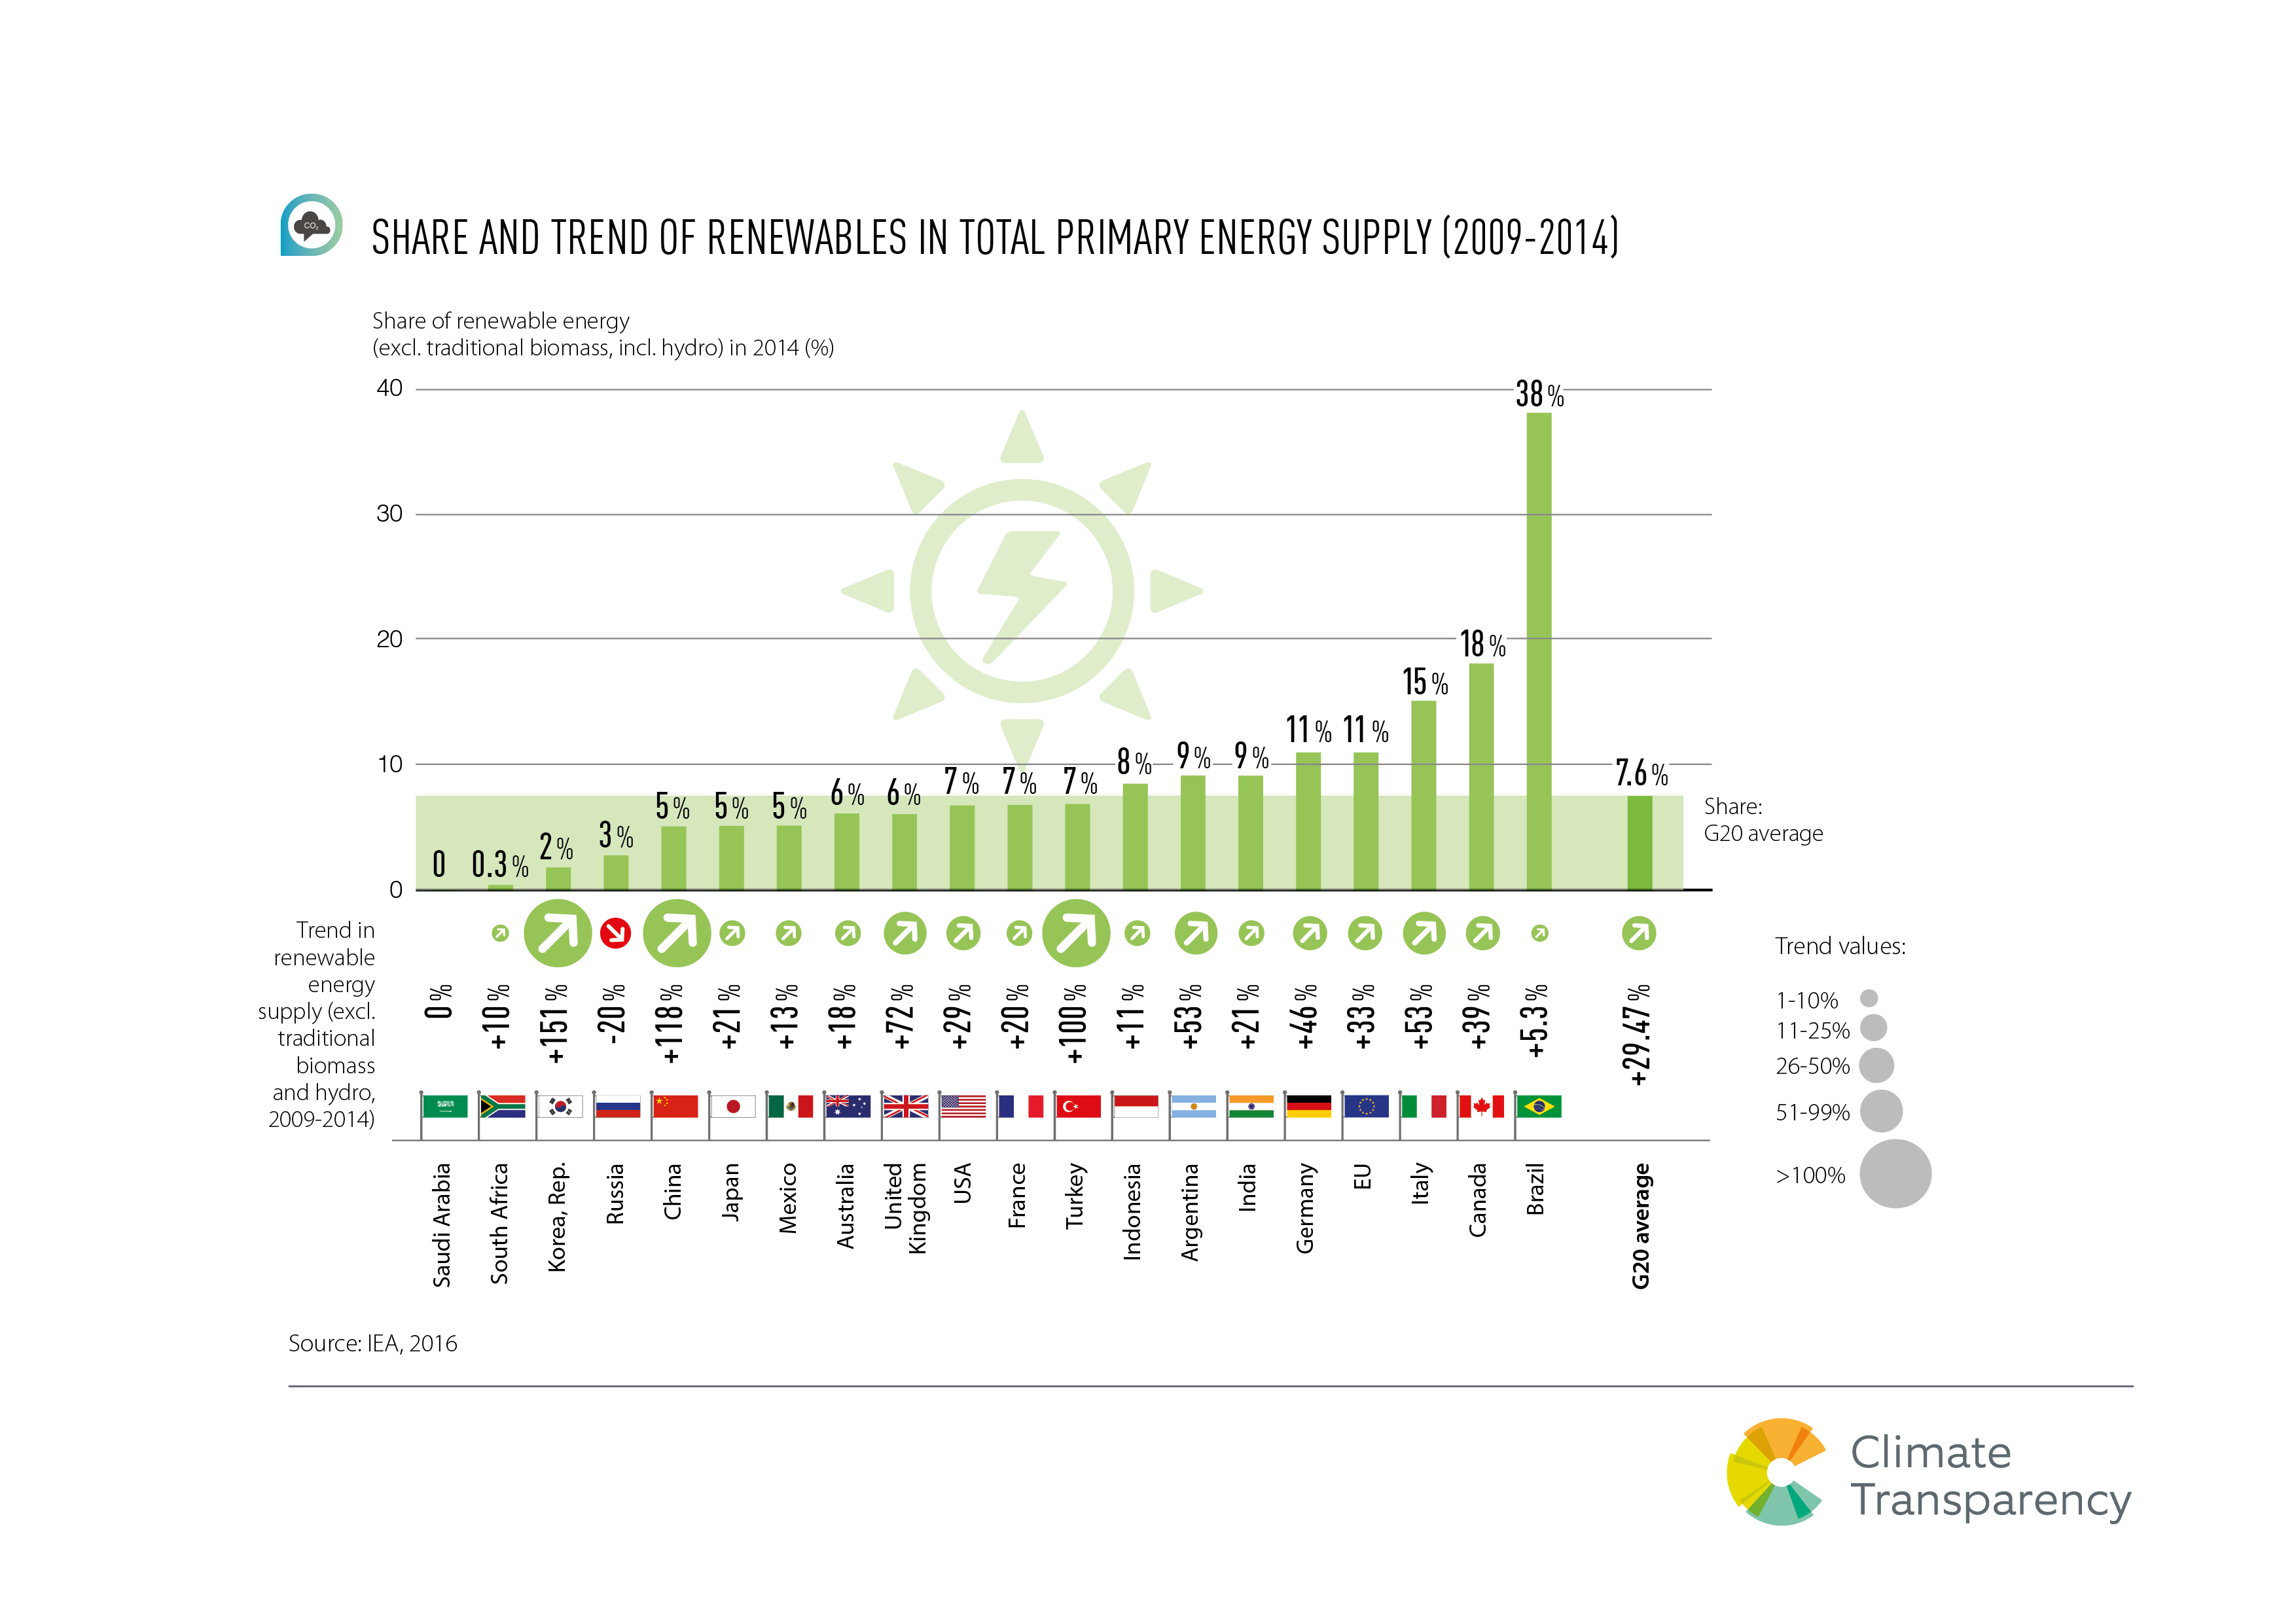
Share and Trend of Renewables in Total Energy Supply (2009 – 2014)
Compares for all G20 countries share of renewably energy (excl. traditional biomass, incl. hydro).
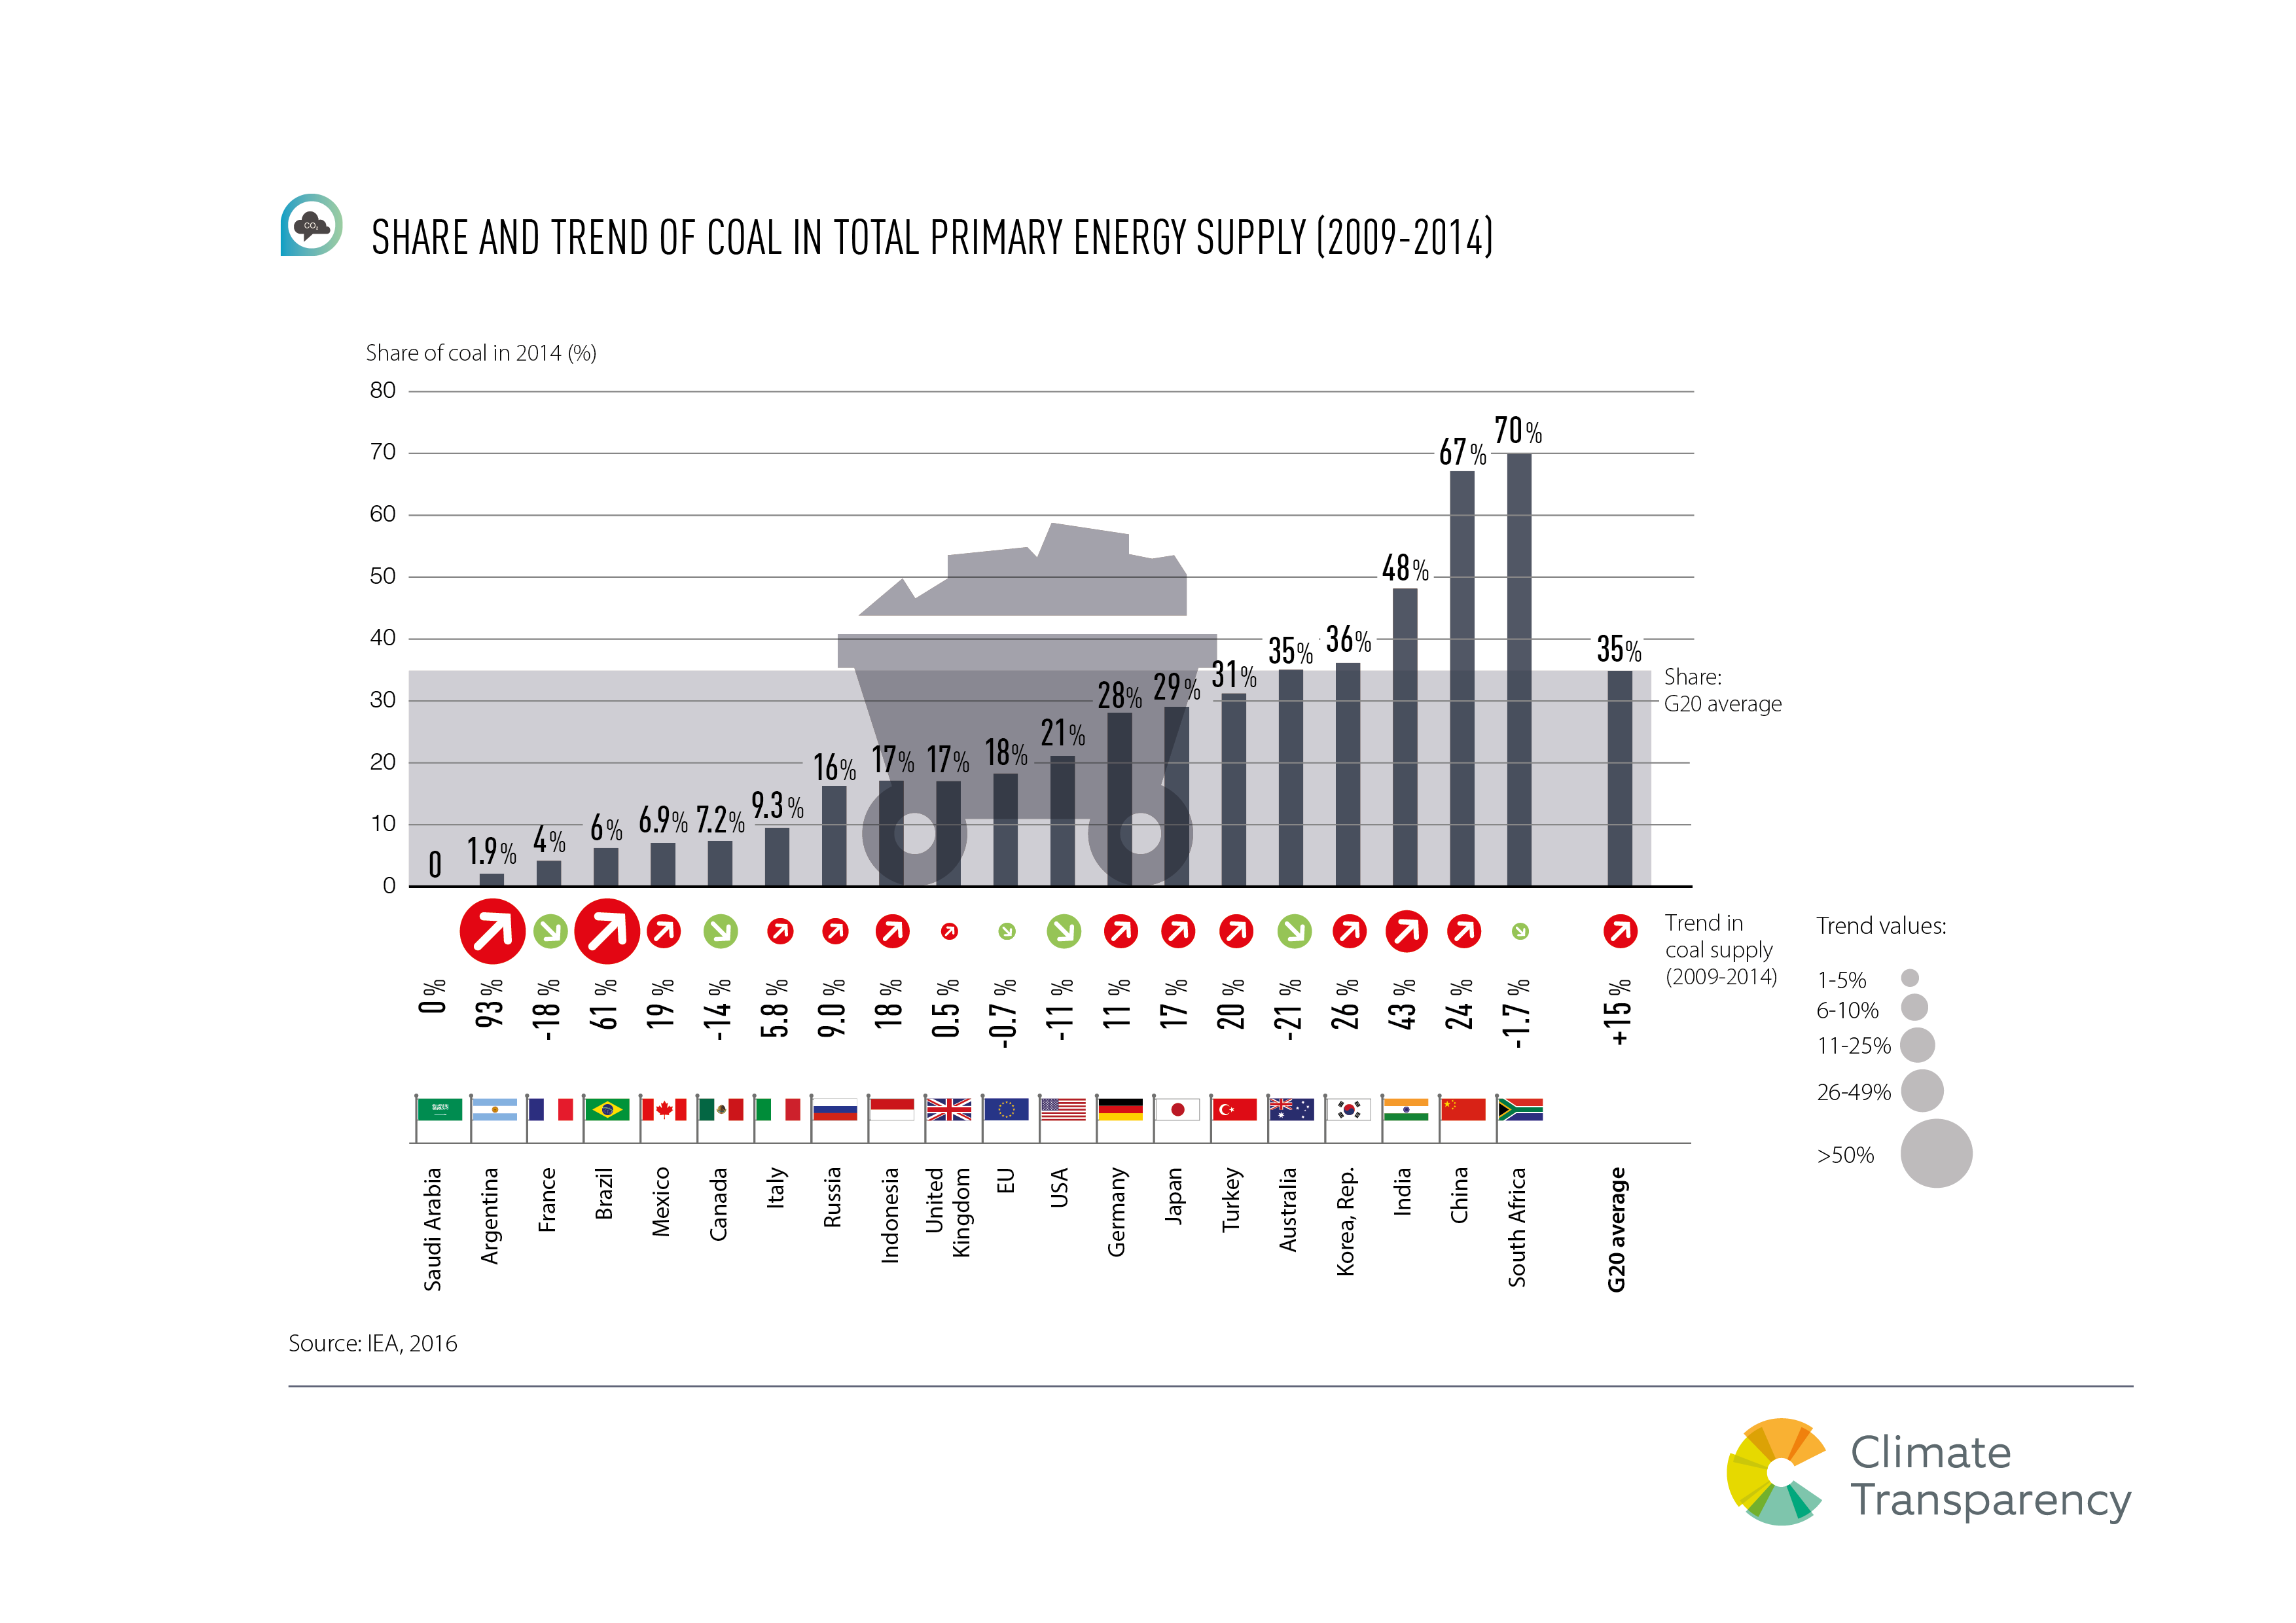
Share and Trend of Coal in Total Primary Energy Supply
Compares for all G20 countries Share of coal in total primary energy supply for 2009 – 2014.